Create plot from an ablation log
ablation_plot(
  ablog,
  type = c("mean", "boxplot", "rank"),
  n = 0L,
  ylab = "Mean configuration cost",
  ylim = NULL,
  rotate_labs = TRUE,
  rename_labs = NULL,
  filename = NULL
)
Arguments
- ablog
list()|character(1)
Ablation log object returned byirace::ablation(). Alternatively, the path to an.Rdatafile, e.g.,"log-ablation.Rdata", from which the object will be loaded.- type
Type of plot. Supported values are
"mean"and"boxplot". Adding"rank"will plot rank per instance instead of raw cost value.- n
integer(1)
Number of steps included in the plot. By default all steps from source to target are included.- ylab
Label of y-axis.
- ylim
Numeric vector of length 2 giving the y-axis range.
- rotate_labs
logical(1)
Whether to rotate labels in x-axis. They are rotated by default because they are typically large.- rename_labs
character()
Renaming table for nicer labels. For example,c("No value"="NA", "LongParameterName"="LPN").- filename
(
character(1)) File name to save the plot, for example"~/path/example/filename.png".
Value
ggplot2::ggplot() boxplot object
See also
Examples
ablog <- read_ablogfile(system.file(package="irace", "exdata", "log-ablation.Rdata"))
ablation_plot(ablog)
 ablation_plot(ablog, type="boxplot", rotate_labs = FALSE)
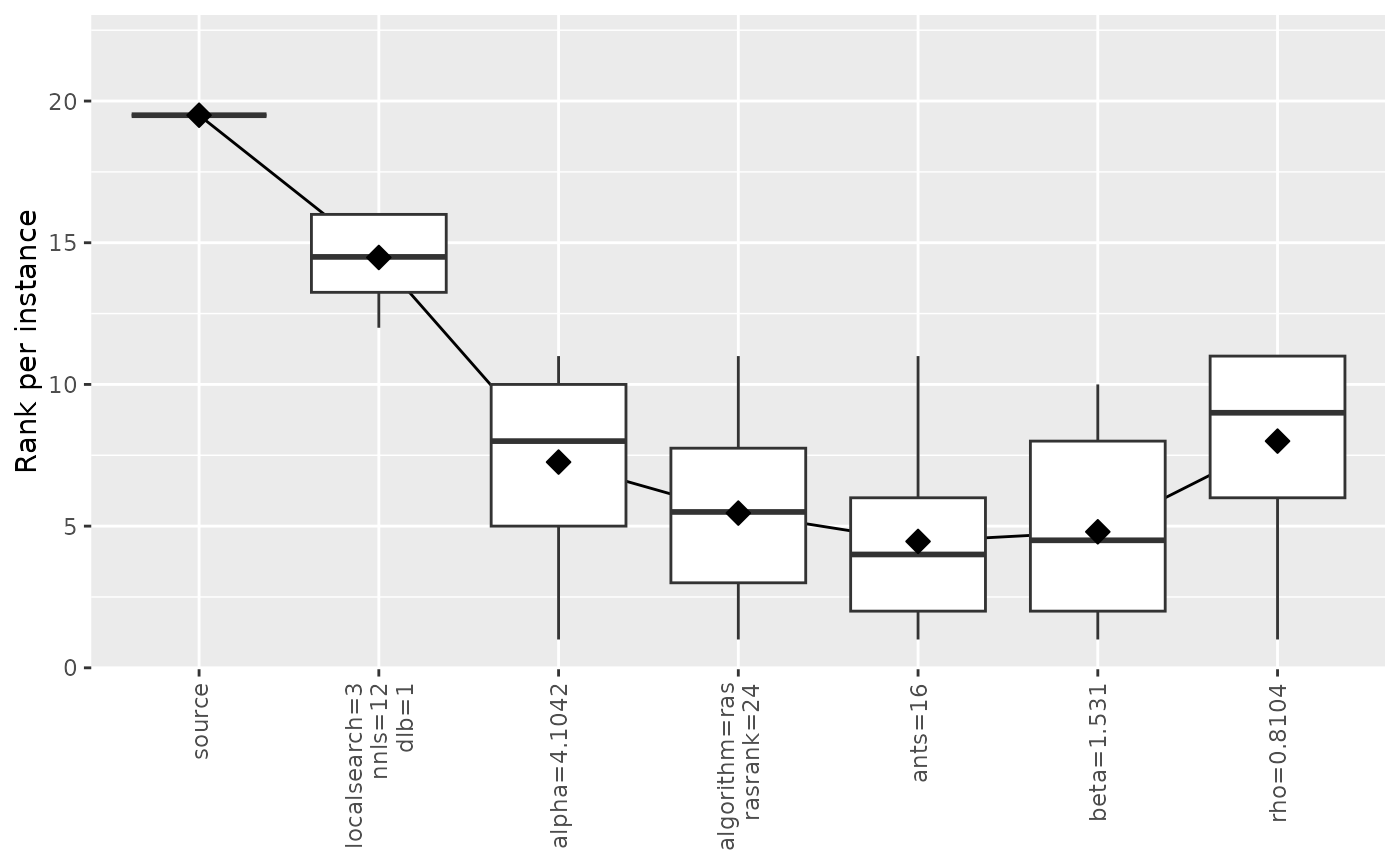
 ablation_plot(ablog, type = "rank,boxplot", rename_labs =
c("localsearch"="ls", algorithm="algo", source="default"))
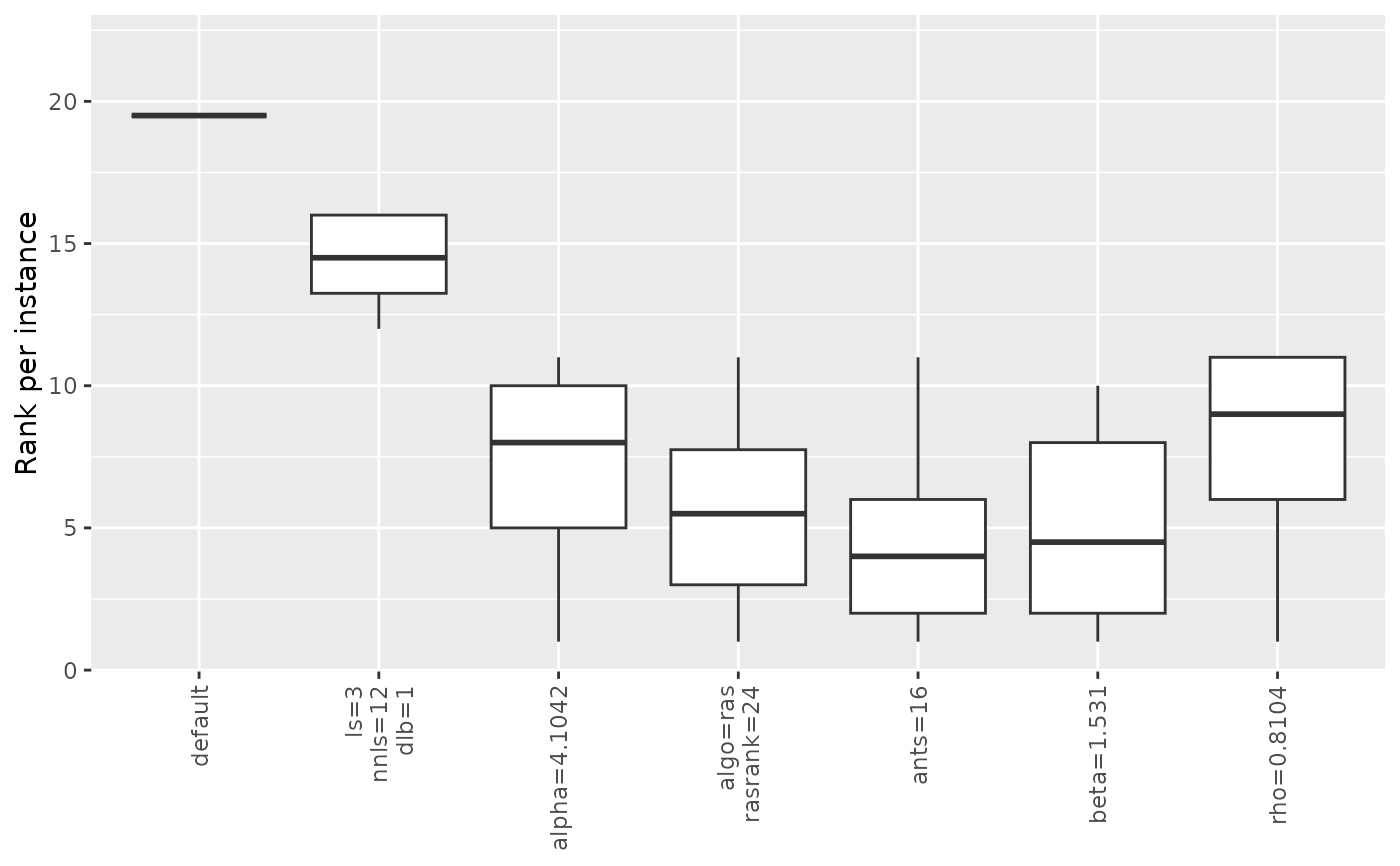
ablation_plot(ablog, type = "rank,boxplot", rename_labs =
c("localsearch"="ls", algorithm="algo", source="default"))
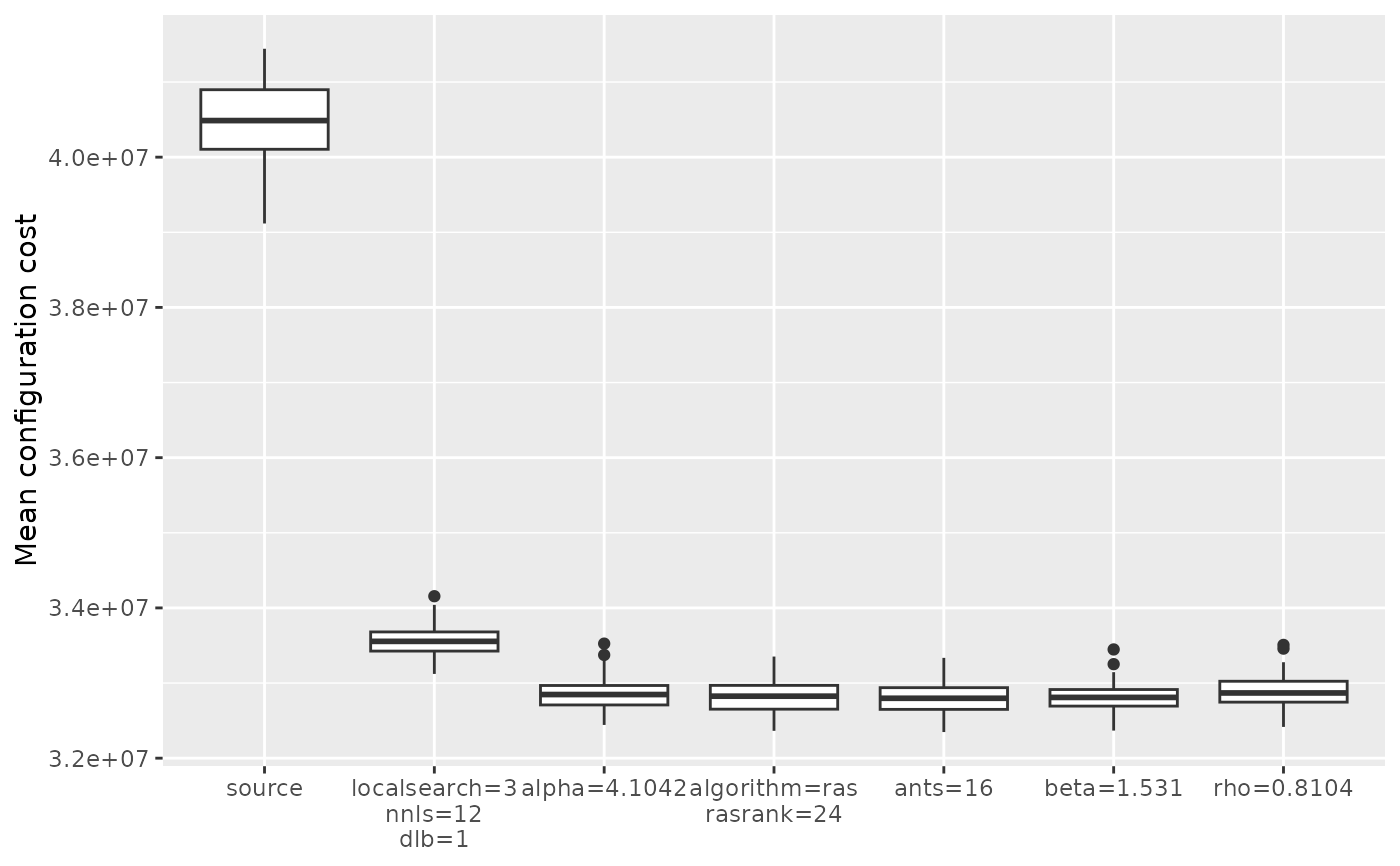
 ablation_plot(ablog, type="rank,mean,boxplot", n = 4, rotate_labs = FALSE)
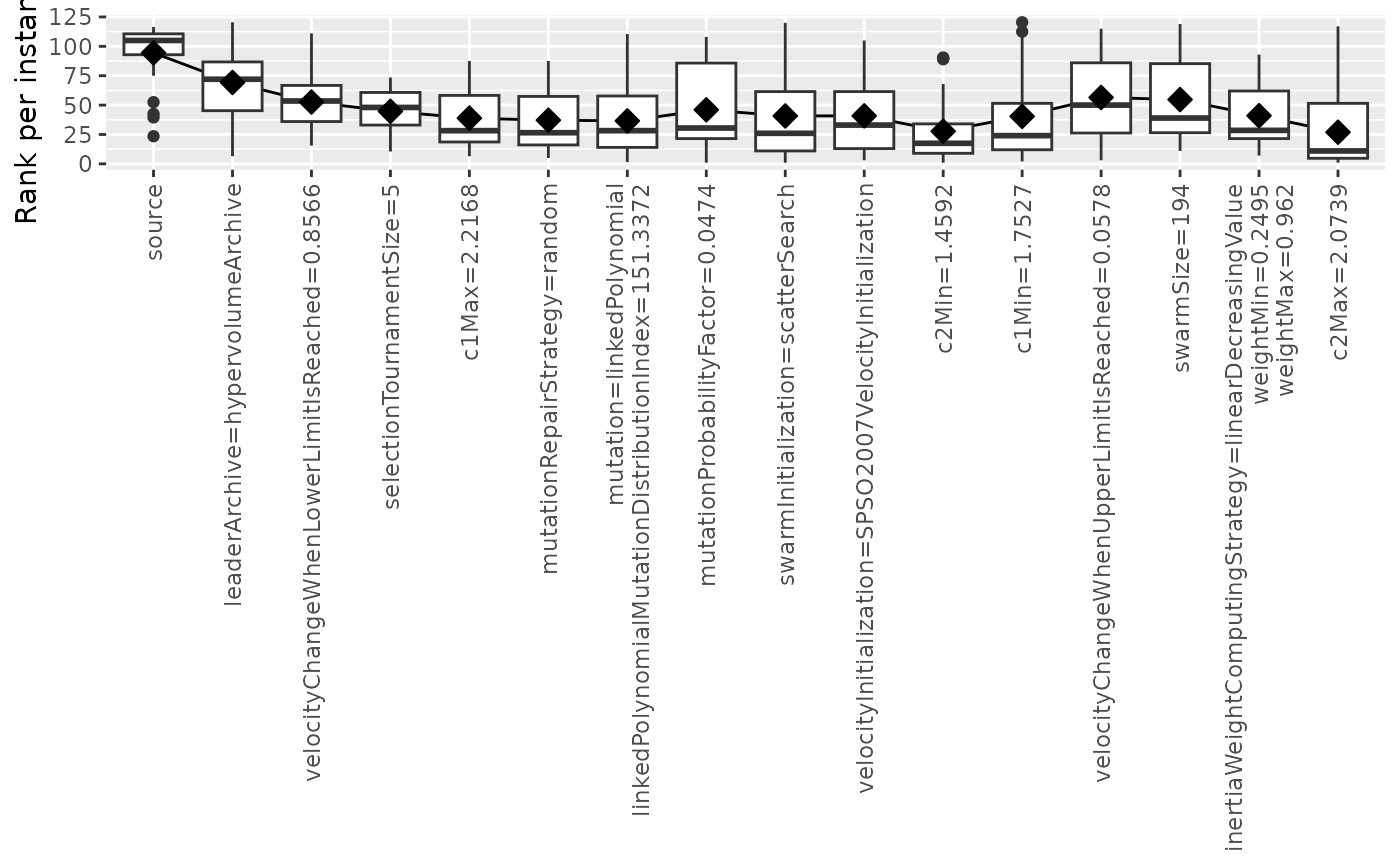
 ablog <- system.file(package="iraceplot", "exdata", "log-ablation-autoMOPSODTLZ.Rdata")
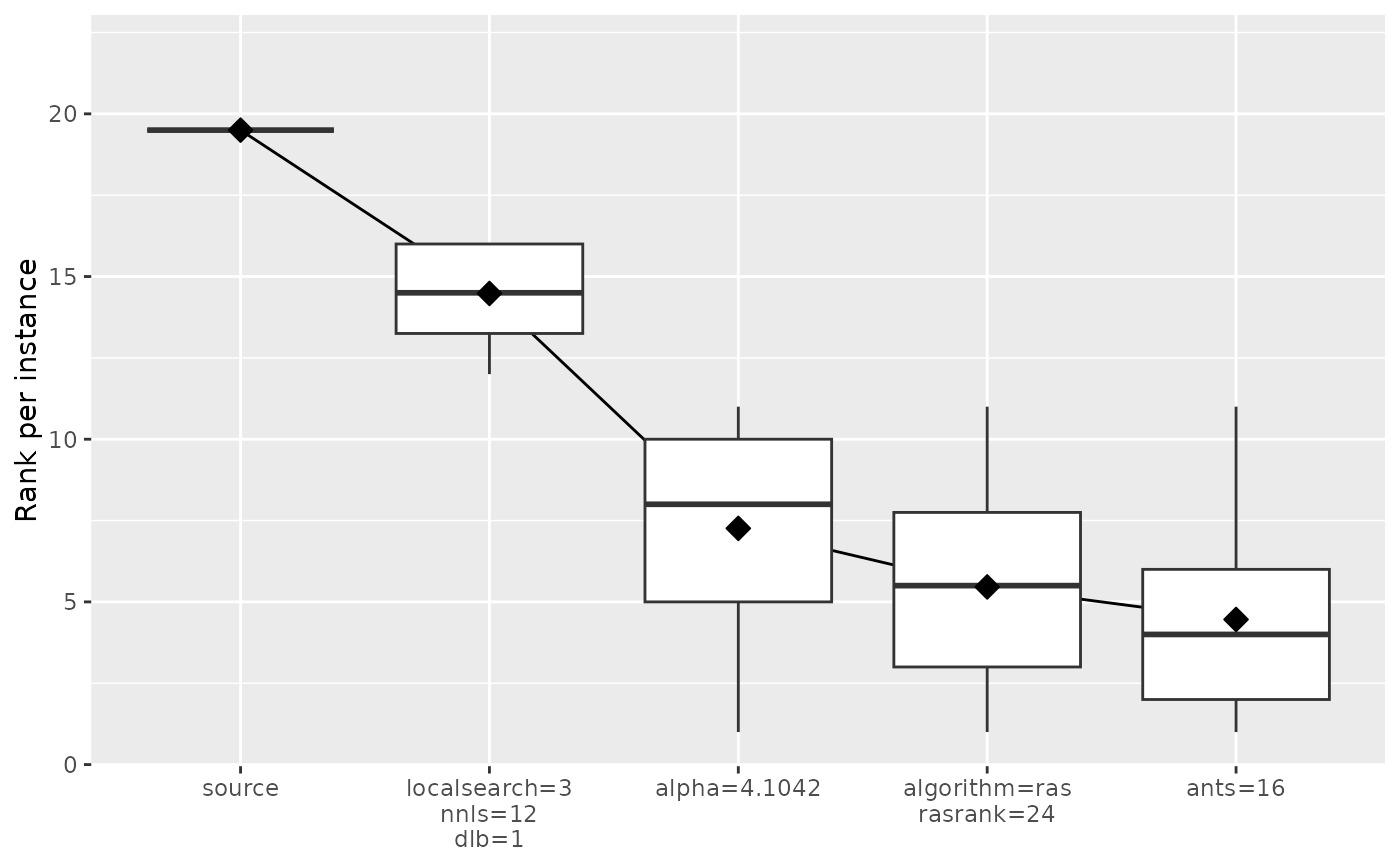
ablation_plot(ablog, type="rank,mean,boxplot")
ablog <- system.file(package="iraceplot", "exdata", "log-ablation-autoMOPSODTLZ.Rdata")
ablation_plot(ablog, type="rank,mean,boxplot")