Box Plot of the performance of a set of configurations
Source:R/boxplot_performance.R
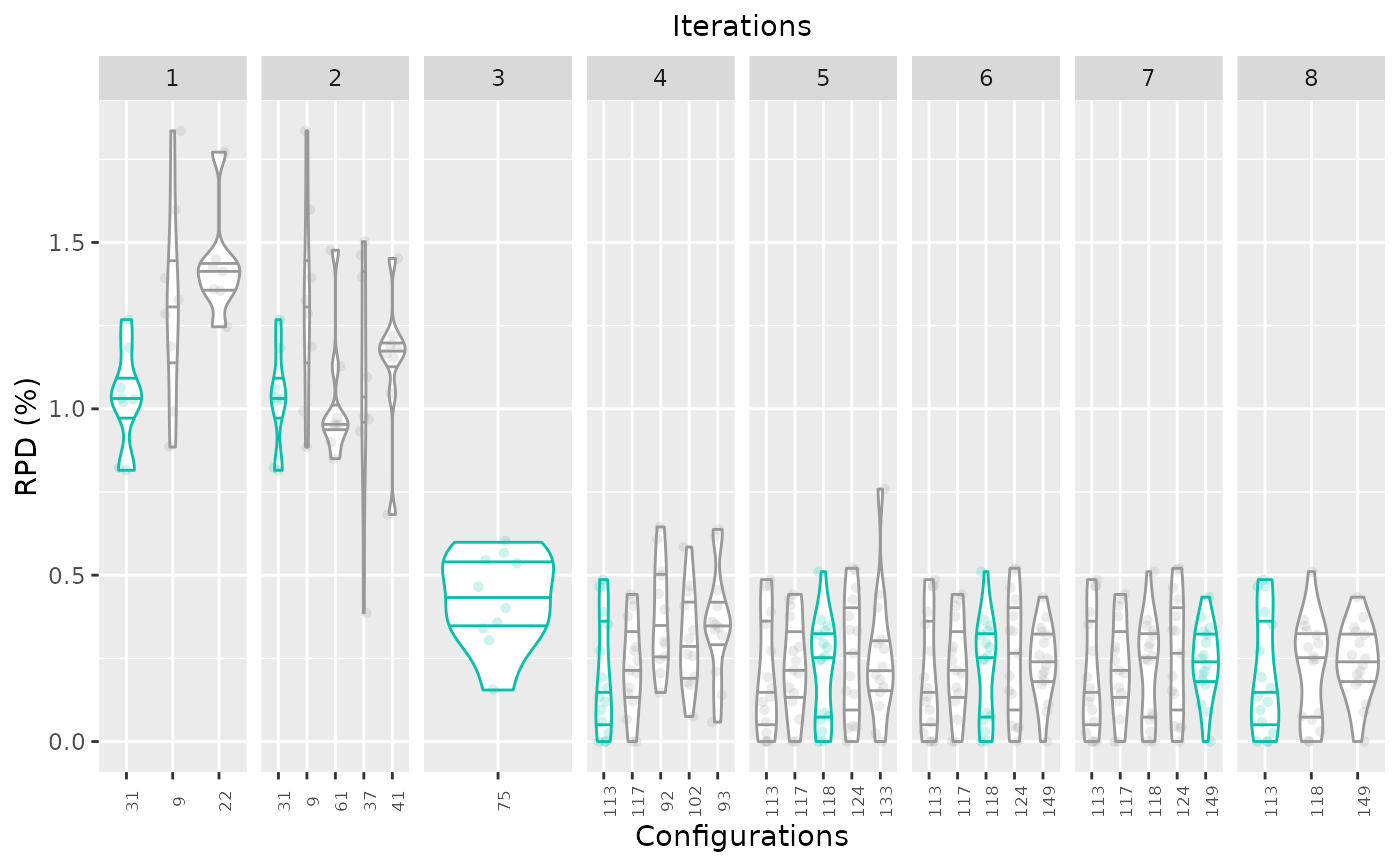
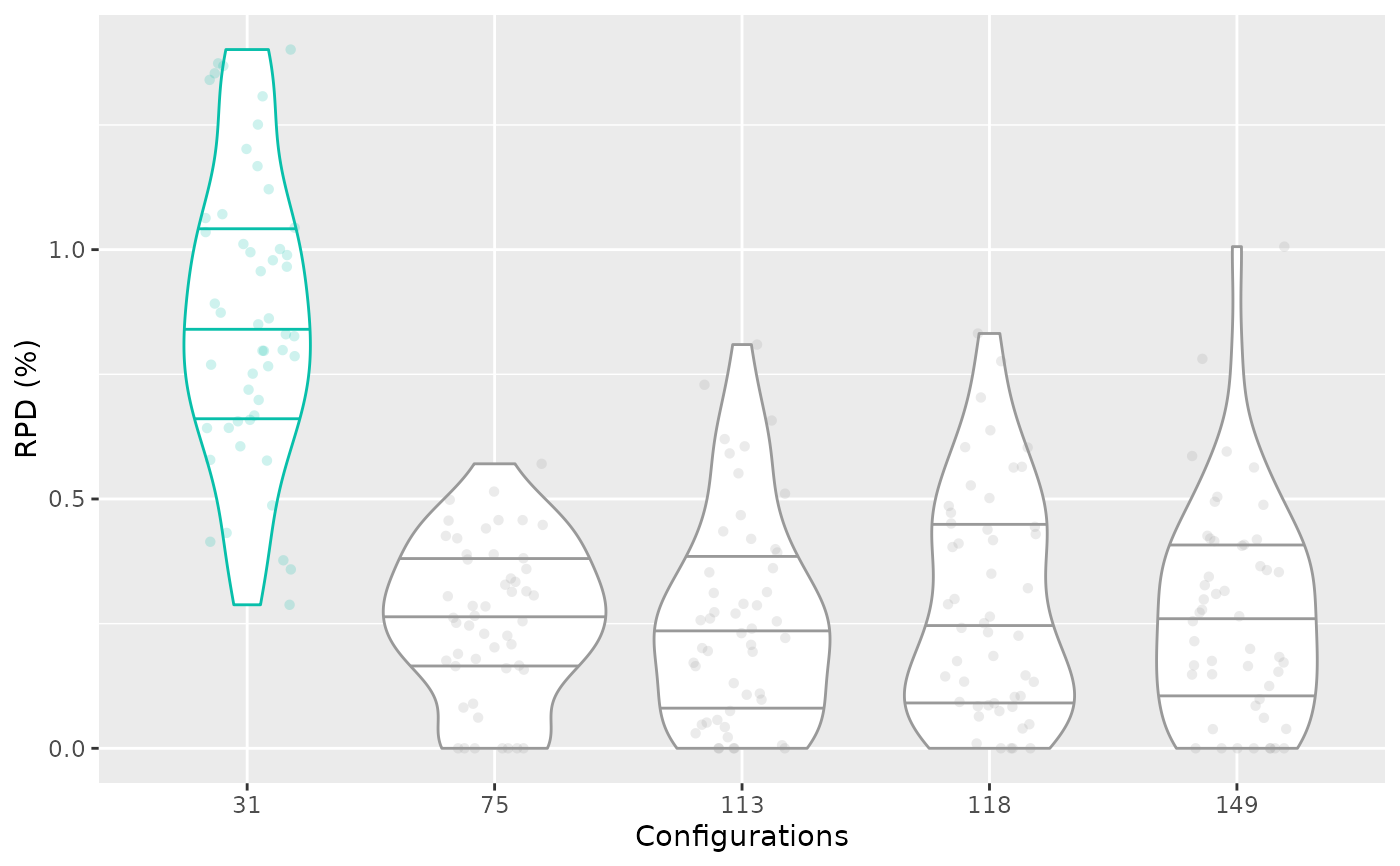
boxplot_performance.RdCreates a box plot that displays the performance of a set of configurations which can be displayed by iteration.
boxplot_performance(
  experiments,
  allElites = NULL,
  type = c("all", "ibest"),
  first_is_best = TRUE,
  rpd = TRUE,
  show_points = TRUE,
  best_color = "#08bfaa",
  xlab = "Configurations",
  boxplot = FALSE,
  filename = NULL,
  interactive = base::interactive()
)
Arguments
- experiments
matrix()
Experiment matrix obtained from irace training or testing data. Configurations in columns and instances in rows. As in irace, column names (configurations IDs) should be characters.- allElites
List or vector of configuration ids, (default NULL). These configurations should be included in the plot. If the argument is not provided all configurations in experiments are included. If allElites is a vector all configurations are assumed without iteration unless argument
type="ibest"is provided, in which case each configuration is assumed to be from a different iteration. IfallElitesis a list, each element of the list is assumed as an iteration.- type
String, (default "all") possible values are "all" or "ibest". "all" shows all the selected configurations showing iterations if the information is provided. "ibest" shows the elite configurations of each iteration, note that the best configuration is always assumed to be first in the vector of each iteration.
- first_is_best
Boolean (default TRUE) Enables the display in a different color the best configuration identified as the first one in a vector. If FALSE, all configurations are shown in the same color.
- rpd
(
logical(1)) TRUE to plot performance as the relative percentage deviation to best results per instance, FALSE to plot raw performance.- show_points
Logical, (default TRUE) TRUE to plot performance points together with the box plot.
- best_color
String, (default
"#08bfaa") color to display best configurations.- xlab
String, (default
"Configurations") label for the x axis.- boxplot
By default, display a violin plot (
ggplot2::geom_violin()). IfTRUE, show a classical boxplot.- filename
(
character(1)) File name to save the plot, for example"~/path/example/filename.png".- interactive
(
logical(1)) TRUE if the report may use interactive features (usingplotly::ggplotly(),plotly::plot_ly()andDT::renderDataTable()) or FALSE if such features must be disabled. Defaults to the value returned byinteractive(),
Value
ggplot2::ggplot() boxplot object
Details
The performance data is obtained from the experiment matrix provided in the experiments argument. The configurations can be selected using the allElites argument and this argument can be also used to define the iteration of each elite configuration was evaluated.
See also
Examples
iraceResults <- read_logfile(system.file(package="irace", "exdata",
"irace-acotsp.Rdata", mustWork = TRUE))
boxplot_performance(iraceResults$experiments, iraceResults$allElites)
 # \donttest{
boxplot_performance(iraceResults$testing$experiments, iraceResults$iterationElites)
# \donttest{
boxplot_performance(iraceResults$testing$experiments, iraceResults$iterationElites)
 # }
# }