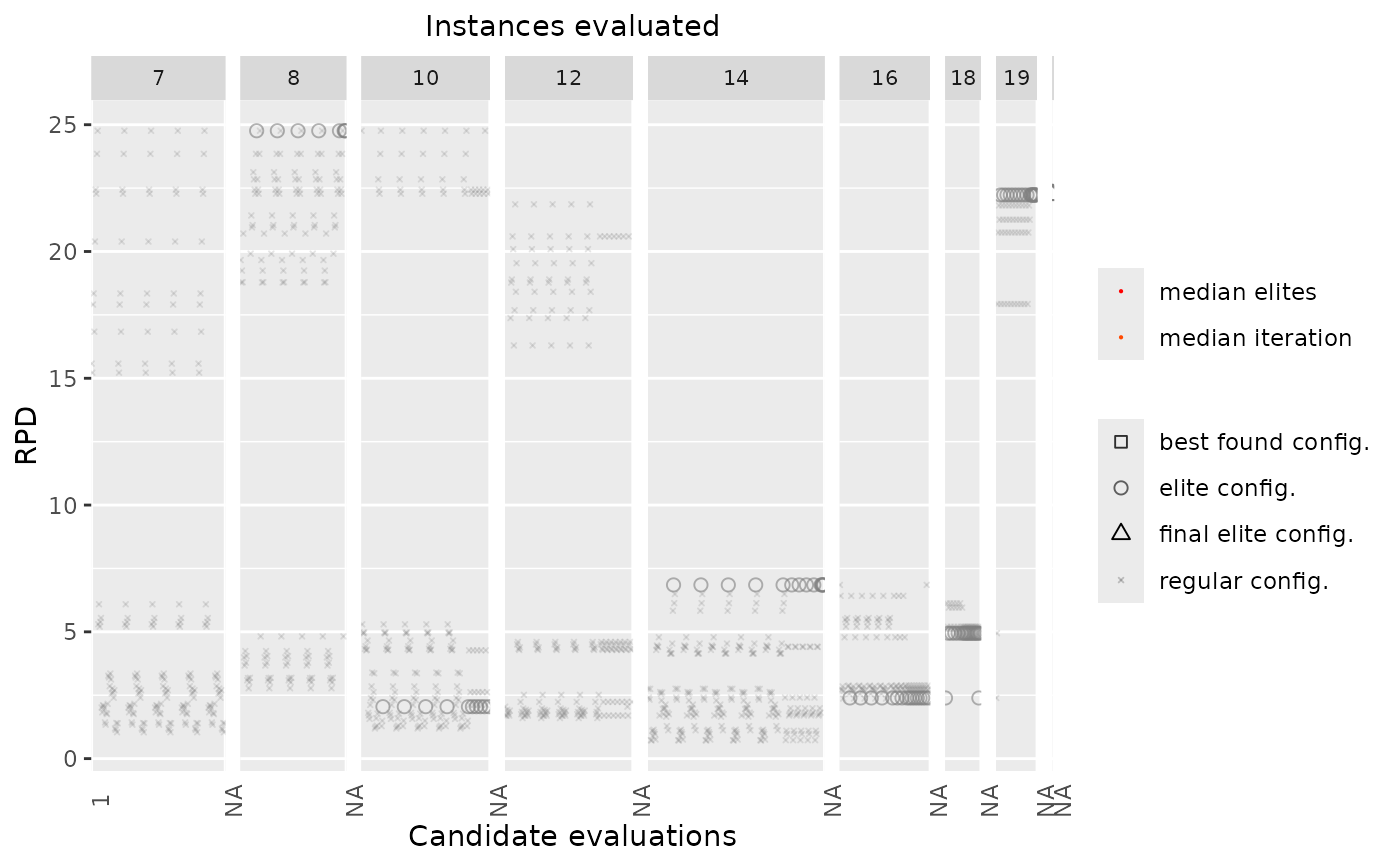
The configurations by iteration and instance
Source:R/configurations_display.R
configurations_display.RdThis is a simplified version of the visualization you can obtain with
acviz. This function is currently
VERY SLOW.
configurations_display(
  irace_results,
  rpd = TRUE,
  filename = NULL,
  interactive = base::interactive()
)
Arguments
- irace_results
The data generated when loading the
.Rdatafile created byirace(or the filename of that file).- rpd
(
logical(1)) TRUE to plot performance as the relative percentage deviation to best results per instance, FALSE to plot raw performance.- filename
(
character(1)) File name to save the plot, for example"~/path/example/filename.png".- interactive
(
logical(1)) TRUE if the report may use interactive features (usingplotly::ggplotly(),plotly::plot_ly()andDT::renderDataTable()) or FALSE if such features must be disabled. Defaults to the value returned byinteractive(),
Value
ggplot2::ggplot() object
Examples
# \donttest{
iraceResults <- read_logfile(system.file(package="iraceplot", "exdata",
                                         "guide-example.Rdata", mustWork = TRUE))
configurations_display(iraceResults)

# }
# }