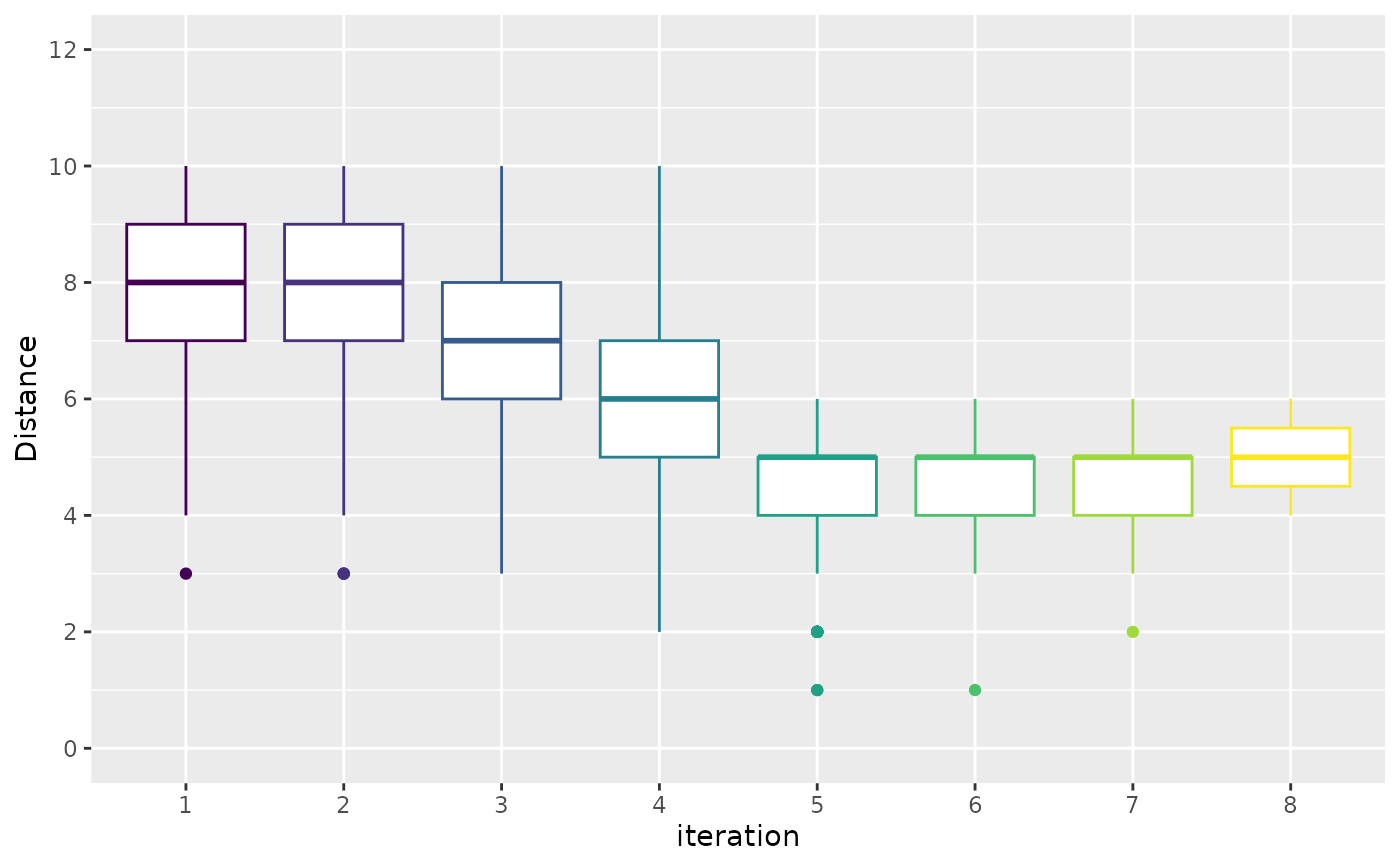
The sampling_distance function creates a plot that displays the mean of the
distance between the configurations that were executed in each iteration.
For categorical parameters the distance is calculated as the hamming distance, for numerical parameters a equality interval is defined by a threshold specified by argument t and hamming distance is calculated using this interval.
sampling_distance(
  irace_results,
  type = c("boxplot", "line", "both"),
  t = 0.05,
  filename = NULL
)
Arguments
- irace_results
The data generated when loading the
.Rdatafile created byirace(or the filename of that file).- type
String, (default "boxplot") Type of plot to be produces, either "line", "boxplot" or "both". The "boxplot" setting shows a boxplot of the mean distance of all configurations, "line" shows the mean distance of the solution population in each iteration, "both" shows both plots.
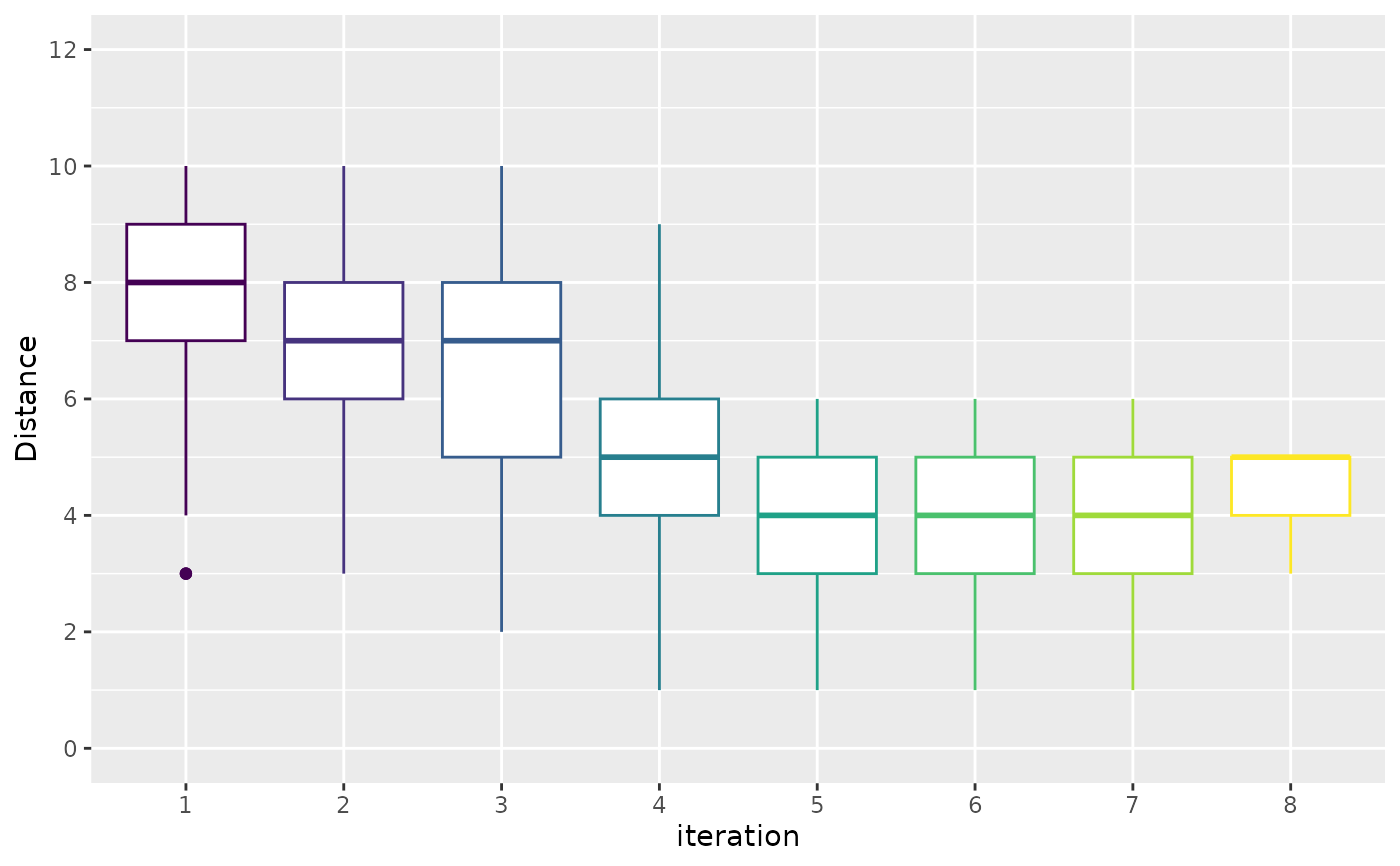
- t
Numeric, (default 0.05) percentage factor that will determine a distance to define equal numerical parameter values. If the numerical parameter values to be compared are v1 and v2 they are considered equal if
|v1-v2| <= |ub-lb|*t.- filename
(
character(1)) File name to save the plot, for example"~/path/example/filename.png".
Value
line or box plot
Examples
iraceResults <- read_logfile(system.file(package="irace", "exdata",
"irace-acotsp.Rdata", mustWork = TRUE))
sampling_distance(iraceResults)
 # \donttest{
sampling_distance(iraceResults, type = "boxplot", t=0.07)
# \donttest{
sampling_distance(iraceResults, type = "boxplot", t=0.07)
 # }
# }