Frequency and Density plot based on its iteration
Source:R/sampling_frequency_iteration.R
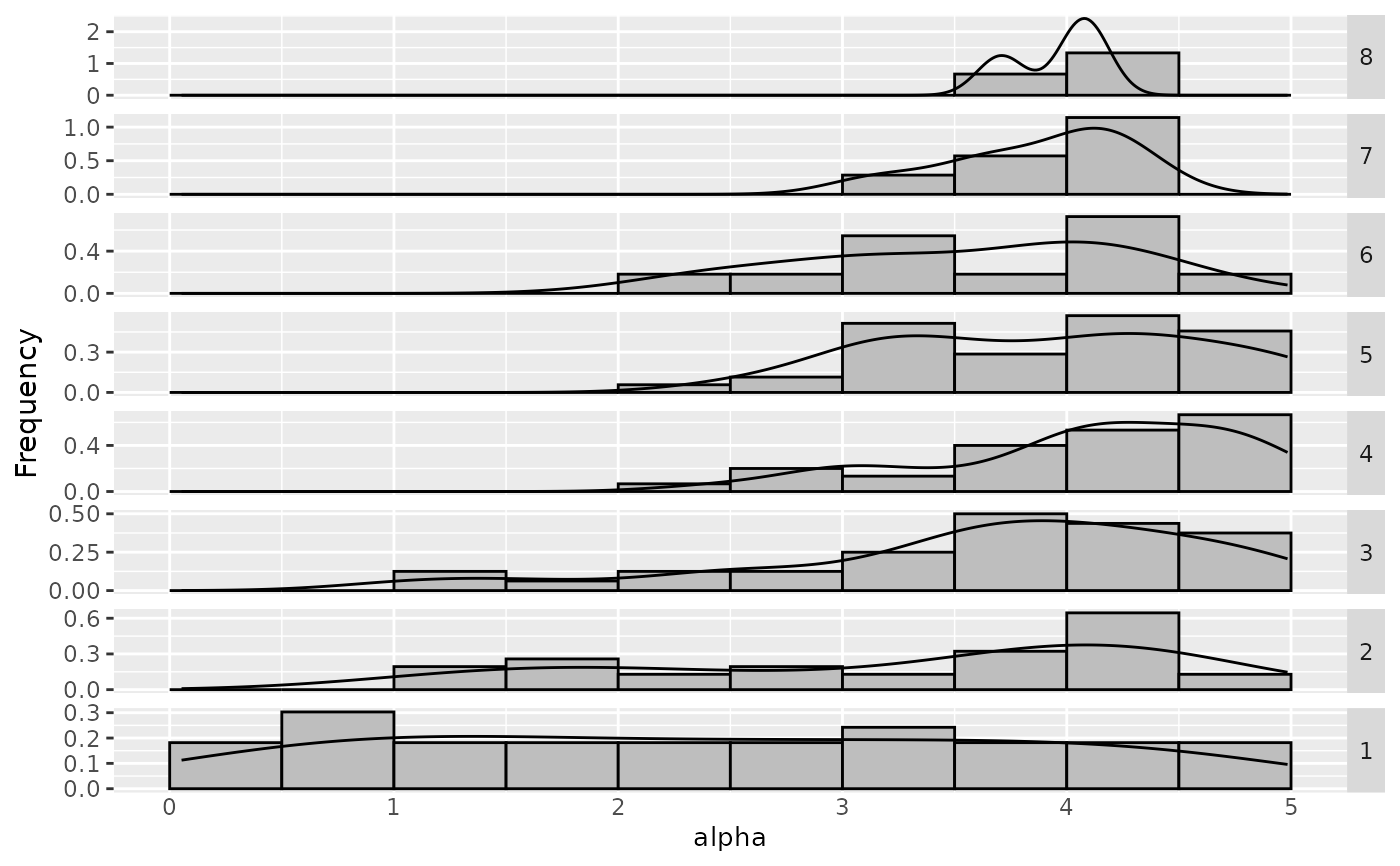
sampling_frequency_iteration.RdThe function will return a frequency plot used for categorical data (its values are string, show a bar plot) or numeric data (show a histogram and density plot) by each iteration
sampling_frequency_iteration(
  irace_results,
  param_name,
  numerical_type = "both",
  filename = NULL
)
Arguments
- irace_results
The data generated when loading the
.Rdatafile created byirace(or the filename of that file).- param_name
String, name of the parameter to be included (example: param_name = "algorithm")
- numerical_type
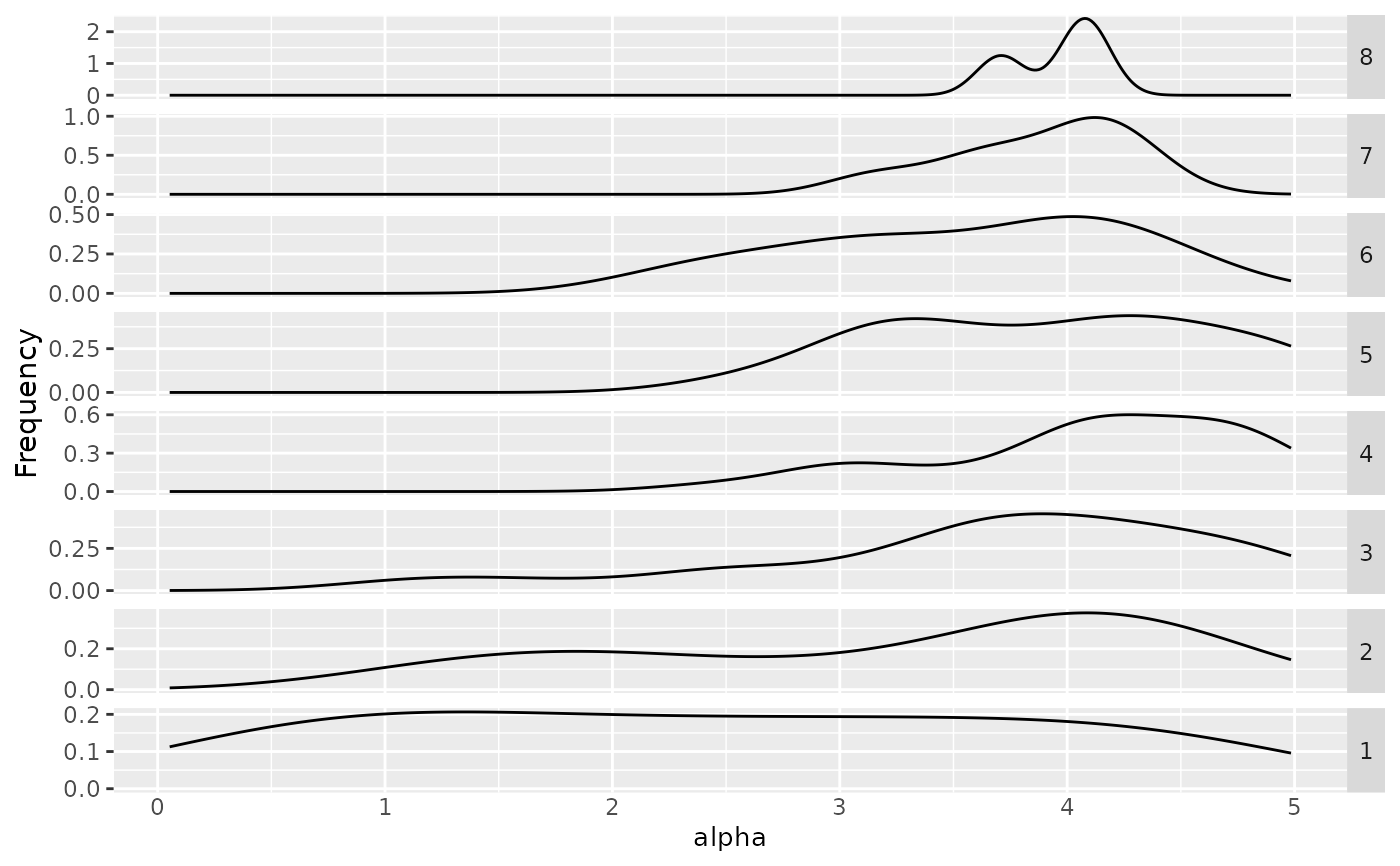
String, (default "both") Indicates the type of plot to be displayed for numerical parameters. "density" shows a density plot, "frequency" shows a frequency plot and "both" show both frequency and density.
- filename
(
character(1)) File name to save the plot, for example"~/path/example/filename.png".
Value
Frequency and/or density plot
Examples
iraceResults <- read_logfile(system.file(package="irace", "exdata",
"irace-acotsp.Rdata", mustWork = TRUE))
sampling_frequency_iteration(iraceResults, param_name = "alpha")
 # \donttest{
sampling_frequency_iteration(iraceResults, param_name = "alpha", numerical_type="density")
# \donttest{
sampling_frequency_iteration(iraceResults, param_name = "alpha", numerical_type="density")
 # }
# }