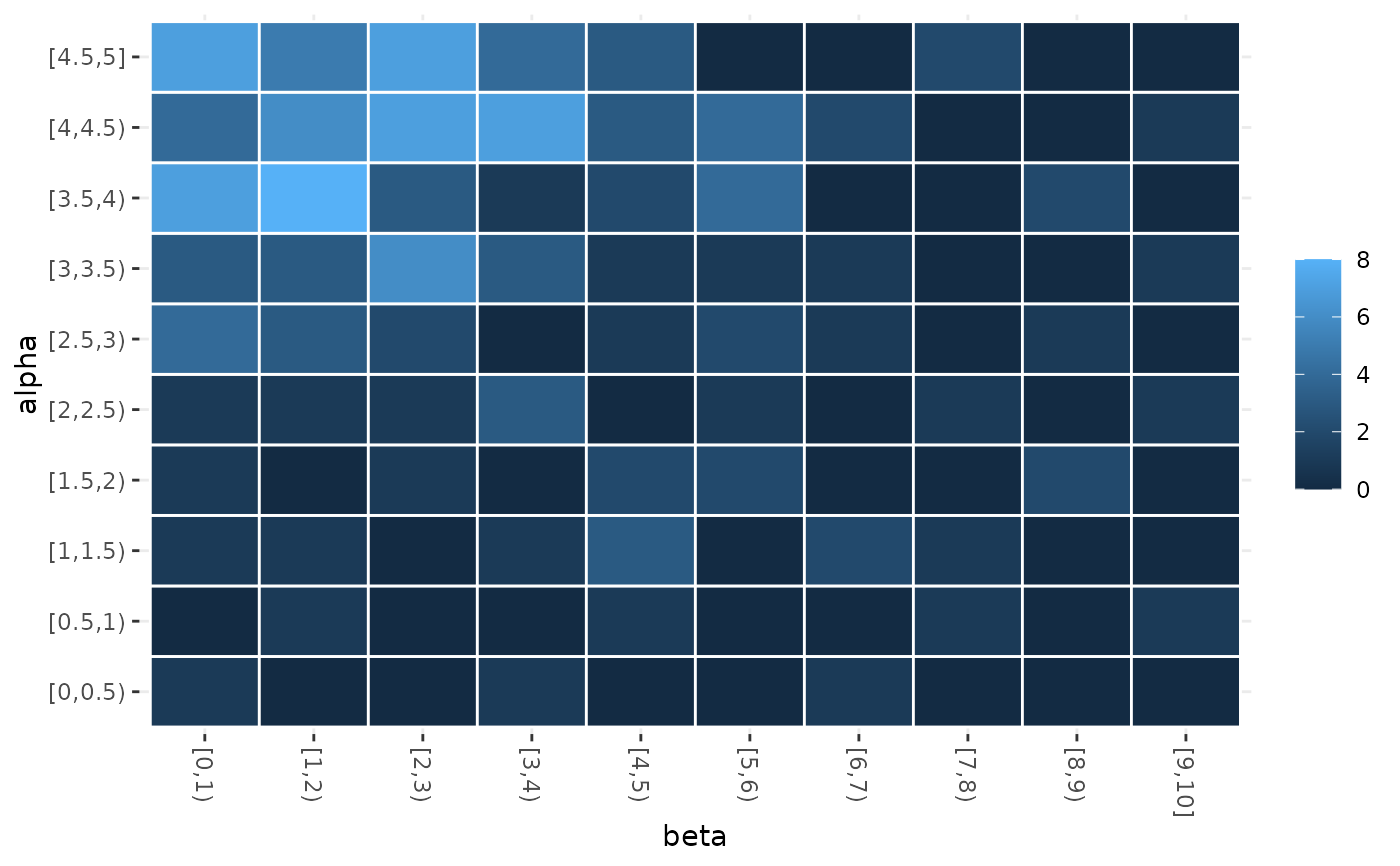
Heatmap that displays the frequency of sampling values of two parameters.
sampling_heatmap(
  irace_results,
  param_names,
  sizes = c(0, 0),
  iterations = NULL,
  only_elite = TRUE,
  filename = NULL
)
Arguments
- irace_results
The data generated when loading the
.Rdatafile created byirace(or the filename of that file).- param_names
(
character()) Parameters to be included in the plot. Example:c("algorithm","alpha","rho","q0","rasrank").- sizes
Numeric vector that indicated the number of intervals to be considered for numerical parameters. This argument is positional with respect to param_names. By default, numerical parameters are displayed using 10 intervals. (example sizes = c(0,10))
- iterations
Numeric vector, iteration number that should be included in the plot (example: iterations = c(1,4,5))
- only_elite
logical (default TRUE), only print elite configurations.
- filename
(
character(1)) File name to save the plot, for example"~/path/example/filename.png".
Value
sampling heat map plot
Examples
iraceResults <- read_logfile(system.file(package="irace", "exdata",
"irace-acotsp.Rdata", mustWork = TRUE))
sampling_heatmap(iraceResults, param_names=c("beta", "alpha"))
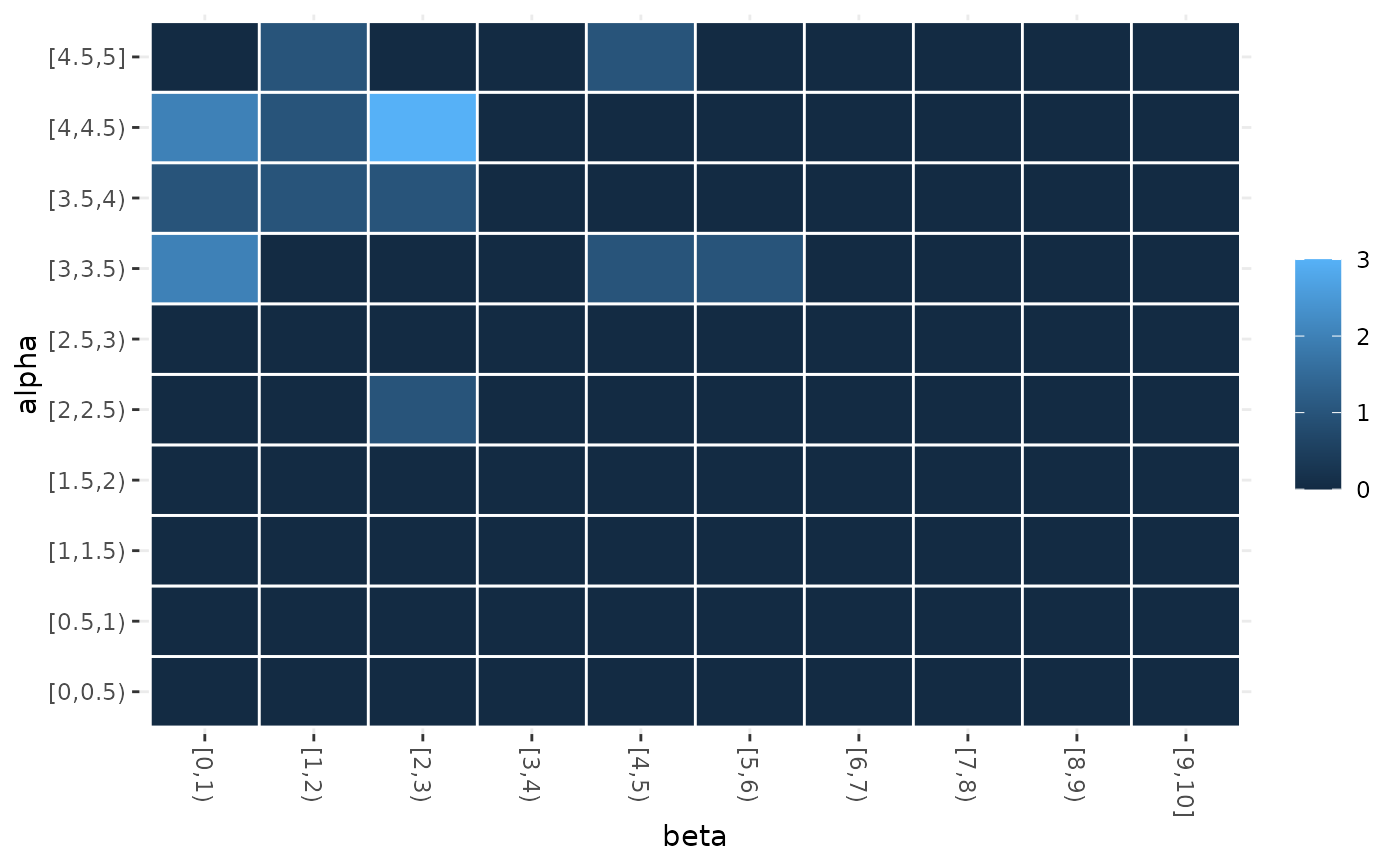 sampling_heatmap(iraceResults, param_names=c("beta", "alpha"), iterations = c(3,4))
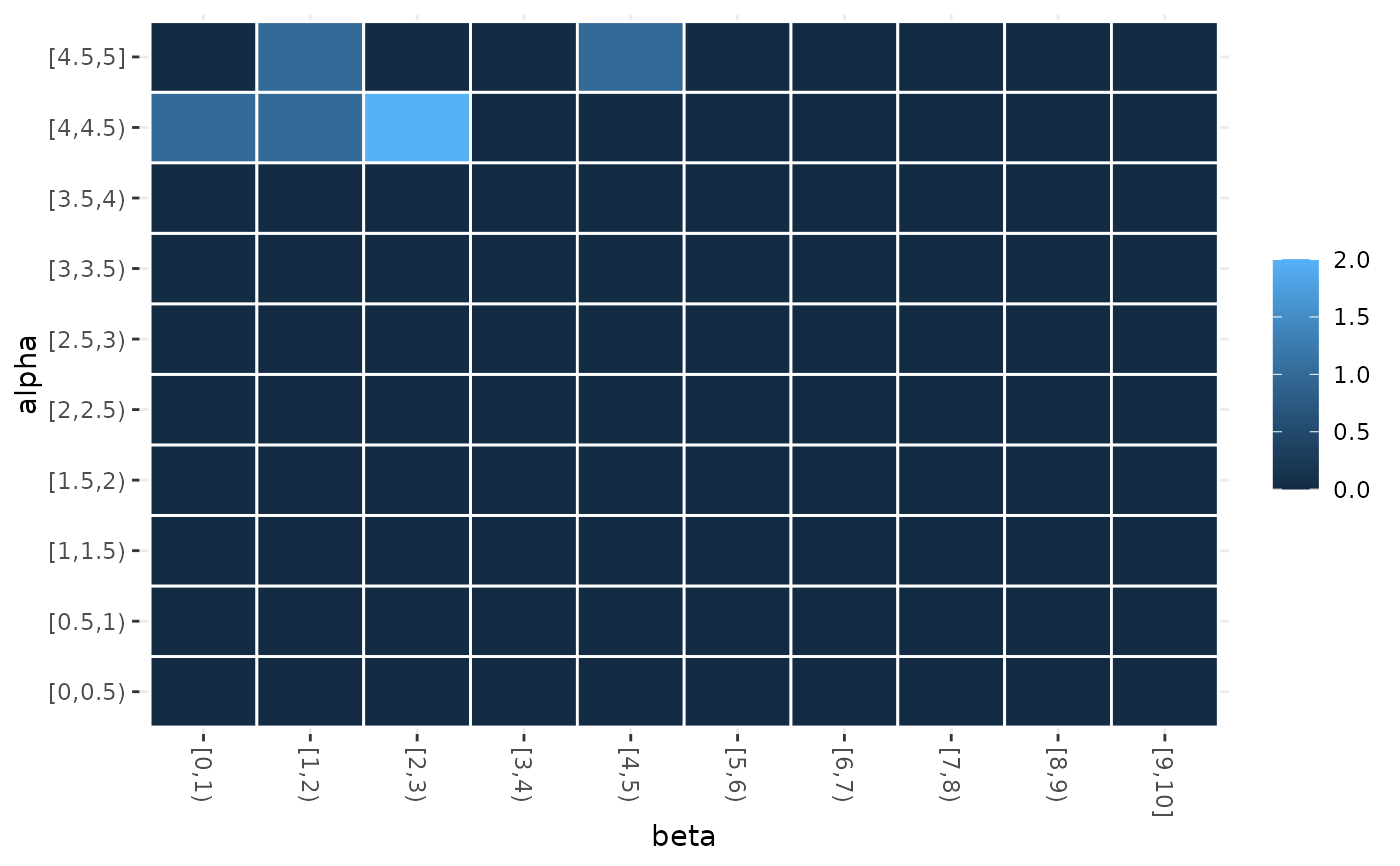 sampling_heatmap(iraceResults, param_names=c("beta", "alpha"), only_elite = FALSE)