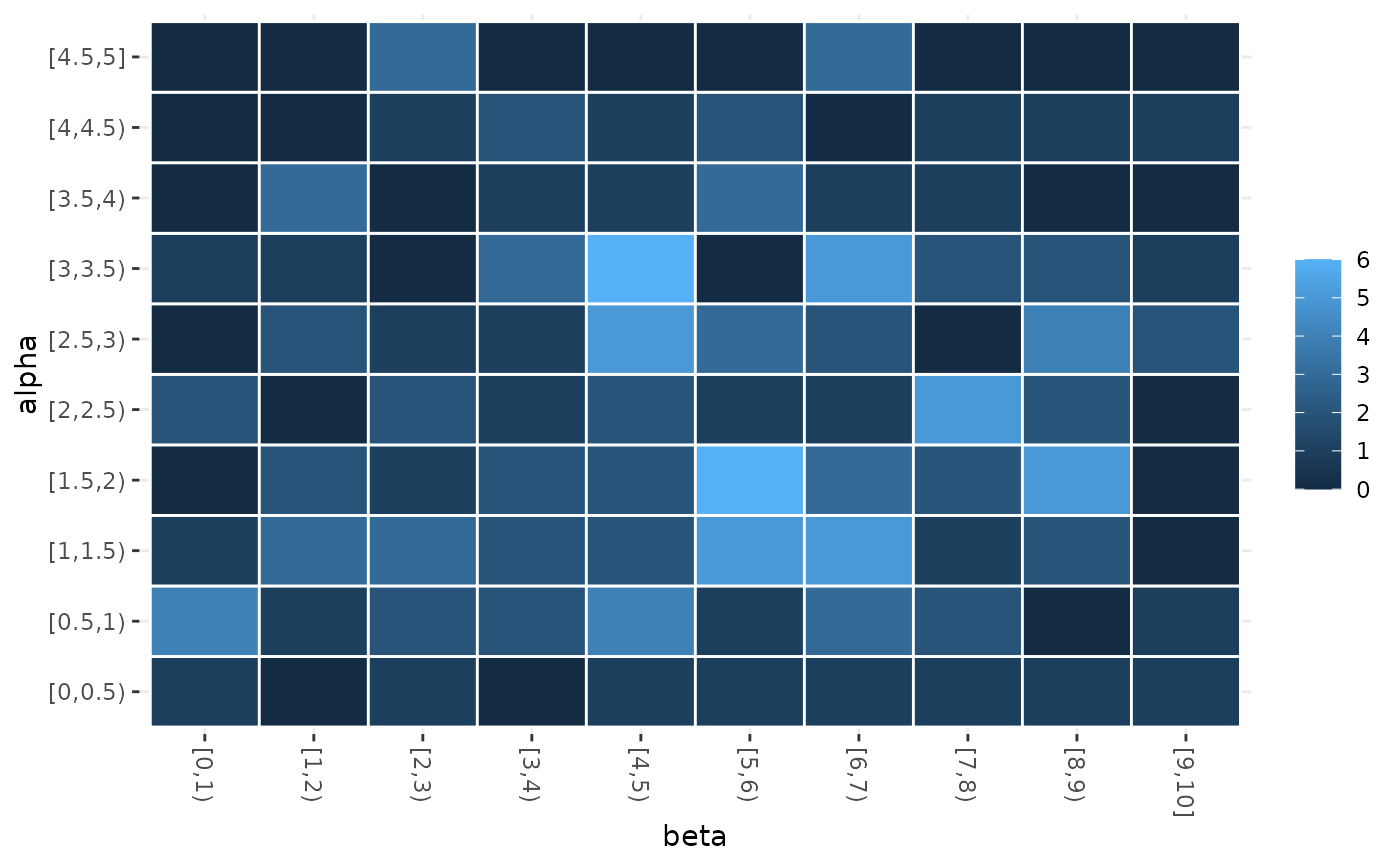
Heatmap that displays the frequency of sampling values of two parameters.
sampling_heatmap2(
  configurations,
  parameters,
  param_names,
  sizes = c(0, 0),
  filename = NULL
)
Arguments
- configurations
Data frame, configurations in
iraceformat (example:configurations = iraceResults$allConfigurations)- parameters
(
list()) Parameter space in irace format. See the functionirace::readParameters().- param_names
String vector of size 2, names of the parameters that should be included in the plot (example: param_names = c("beta","alpha"))
- sizes
Numeric vector that indicated the number of intervals to be considered for numerical parameters. This argument is positional with respect to param_names. By default, numerical parameters are displayed using 10 intervals. (example sizes = c(0,10))
- filename
(
character(1)) File name to save the plot, for example"~/path/example/filename.png".
Value
sampling heat map plot
Examples
iraceResults <- read_logfile(system.file(package="irace", "exdata",
                                         "irace-acotsp.Rdata", mustWork = TRUE))
sampling_heatmap2(iraceResults$allConfigurations, iraceResults$scenario$parameters,
                  param_names=c("beta", "alpha"))