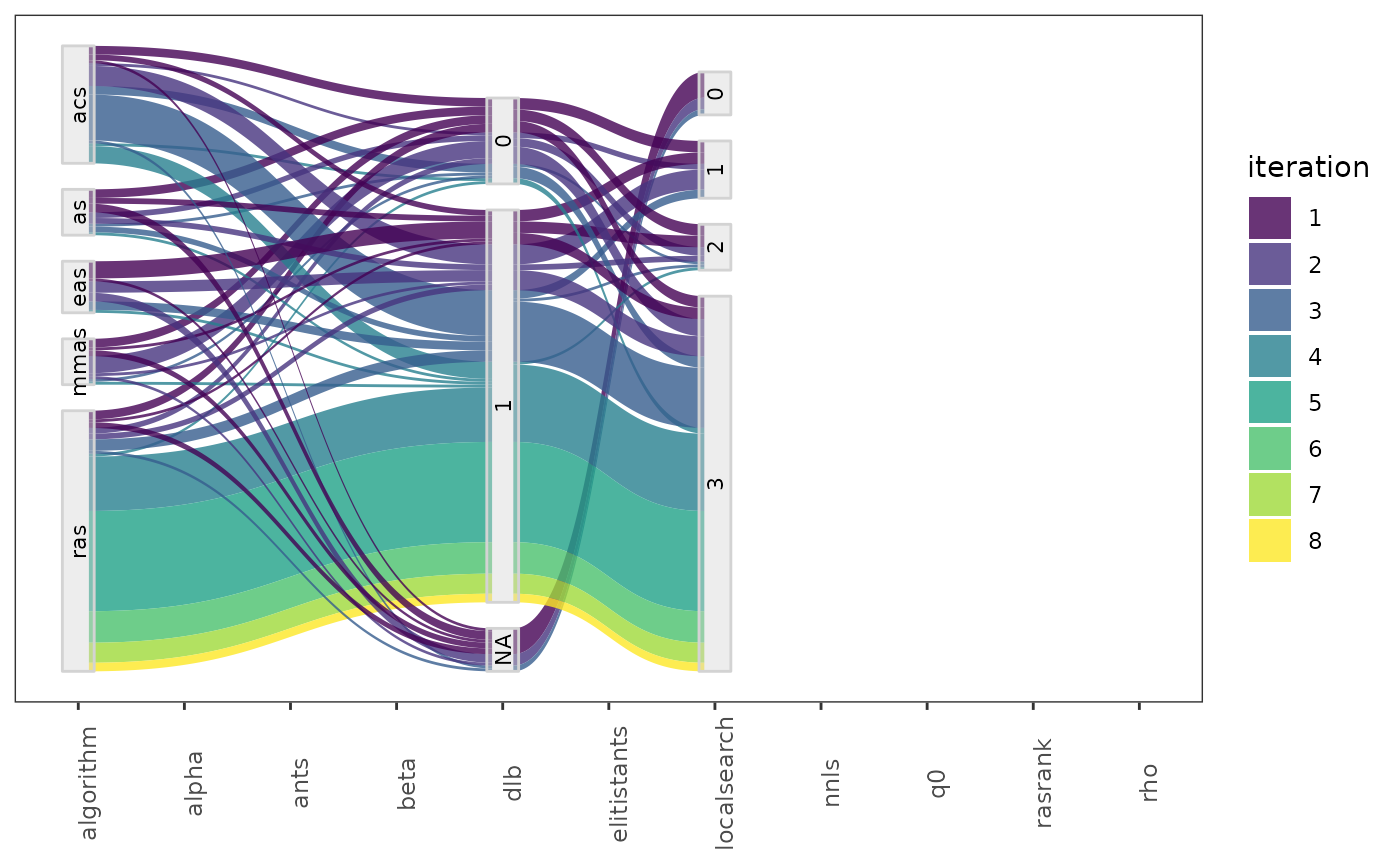
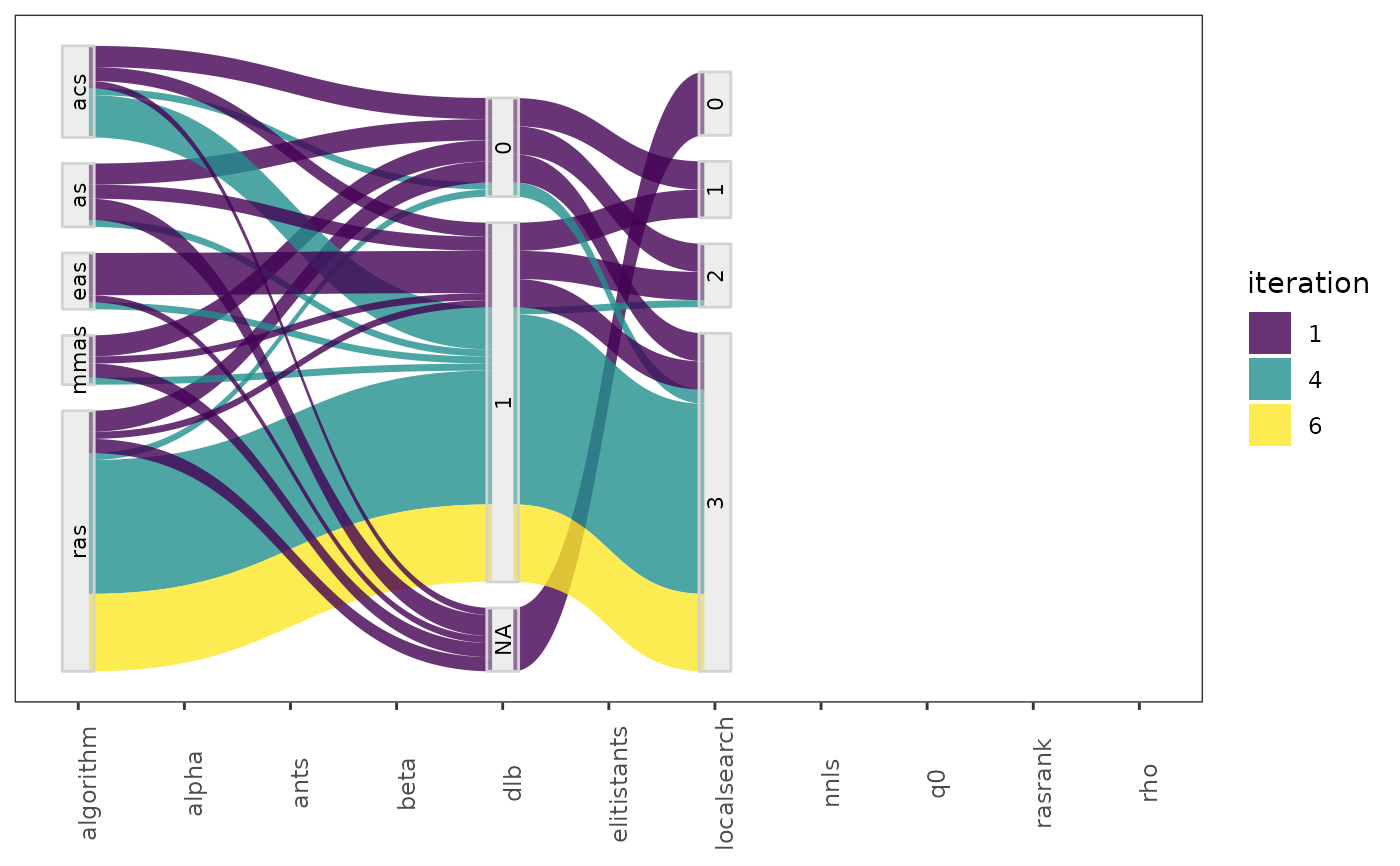
Parallel categories plot of selected configurations. Numerical parameters
are discretized to maximum n_bins intervals. To visualize configurations
of other iterations these must be provided setting the argument iterations,
groups of configurations of different iterations are shown in different
colors. Specific configurations can be selected providing their ids in the
id_configurations argument.
parallel_cat(
  irace_results,
  id_configurations = NULL,
  param_names = NULL,
  iterations = NULL,
  by_n_param = NULL,
  n_bins = 3,
  filename = NULL
)
Arguments
- irace_results
The data generated when loading the
.Rdatafile created byirace(or the filename of that file).- id_configurations
Configuration ids to be included in the plot. Example:
c(20,50,100,300,500,600,700)- param_names
(
character()) Parameters to be included in the plot. Example:c("algorithm","alpha","rho","q0","rasrank").- iterations
Numeric vector, iterations from which configuration should be obtained (example: iterations = c(1,4,5))
- by_n_param
Numeric (optional), maximum number of parameters to be displayed.
- n_bins
Numeric (default 3), number of intervals to generate for numerical parameters.
- filename
(
character(1)) File name to save the plot, for example"~/path/example/filename.png".
Value
parallel categories plot
Details
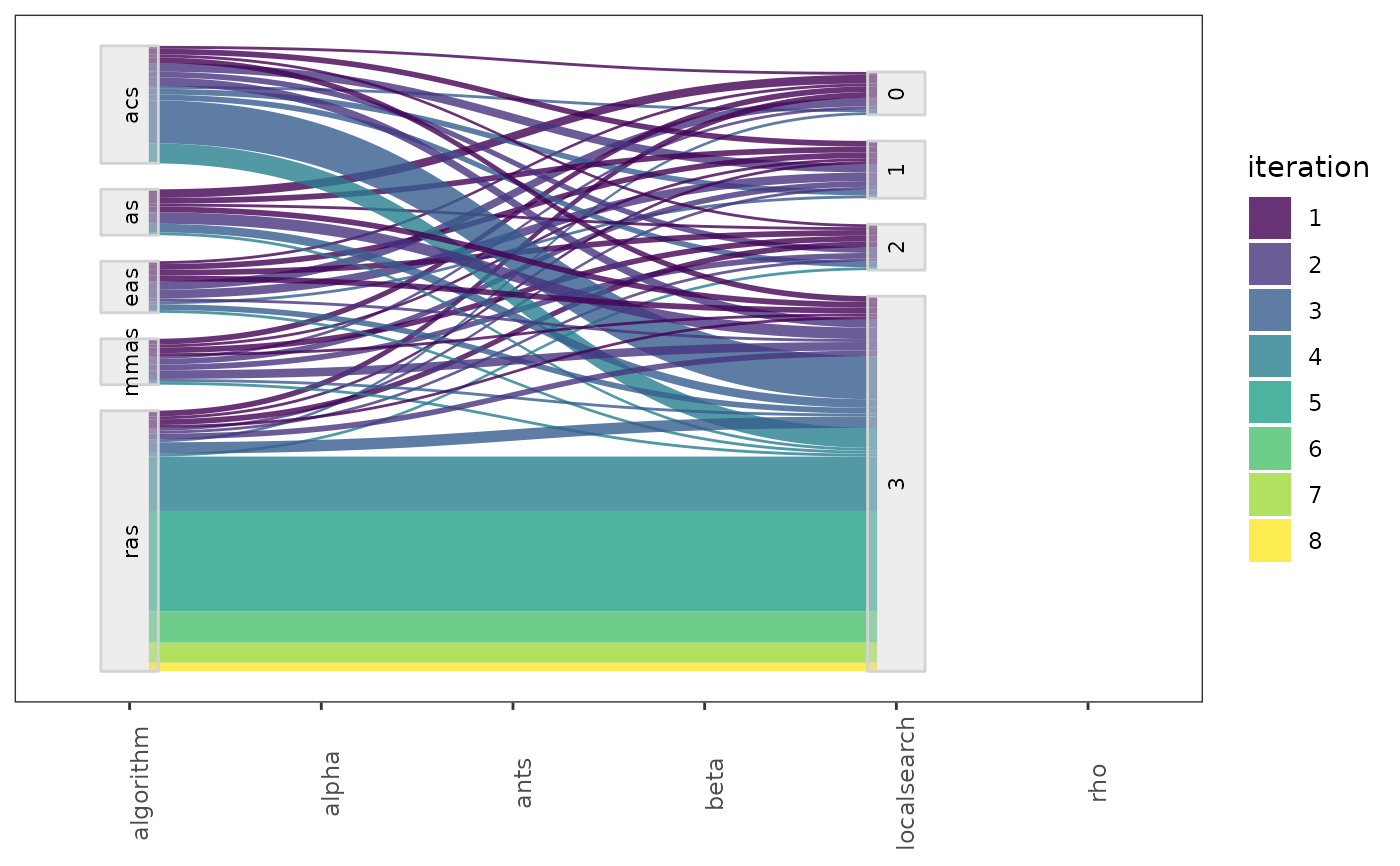
The parameters to be included in the plot can be selected with the param_names argument. Additionally, the maximum number of parameters to be displayed in one plot. A list of plots is returned by this function in several plots are required to display the selected data.
See also
Examples
iraceResults <- read_logfile(system.file(package="irace", "exdata",
"irace-acotsp.Rdata", mustWork = TRUE))
parallel_cat(iraceResults)
#> Warning: Coercing 'character' RHS to 'double' to match the type of column 5 named 'alpha'.
#> Warning: NAs introduced by coercion
#> Warning: Coercing 'character' RHS to 'double' to match the type of column 5 named 'alpha'.
#> Warning: NAs introduced by coercion
#> Warning: Coercing 'character' RHS to 'double' to match the type of column 6 named 'beta'.
#> Warning: NAs introduced by coercion
#> Warning: Coercing 'character' RHS to 'double' to match the type of column 6 named 'beta'.
#> Warning: NAs introduced by coercion
#> Warning: Coercing 'character' RHS to 'double' to match the type of column 7 named 'rho'.
#> Warning: NAs introduced by coercion
#> Warning: Coercing 'character' RHS to 'double' to match the type of column 7 named 'rho'.
#> Warning: NAs introduced by coercion
#> Warning: Coercing 'character' RHS to 'double' to match the type of column 8 named 'ants'.
#> Warning: NAs introduced by coercion
#> Warning: Coercing 'character' RHS to 'double' to match the type of column 8 named 'ants'.
#> Warning: NAs introduced by coercion
#> Warning: Coercing 'character' RHS to 'double' to match the type of column 9 named 'nnls'.
#> Warning: NAs introduced by coercion
#> Warning: Coercing 'character' RHS to 'double' to match the type of column 9 named 'nnls'.
#> Warning: NAs introduced by coercion
#> Warning: Coercing 'character' RHS to 'double' to match the type of column 10 named 'q0'.
#> Warning: NAs introduced by coercion
#> Warning: Coercing 'character' RHS to 'double' to match the type of column 10 named 'q0'.
#> Warning: NAs introduced by coercion
#> Warning: Coercing 'character' RHS to 'double' to match the type of column 12 named 'rasrank'.
#> Warning: NAs introduced by coercion
#> Warning: Coercing 'character' RHS to 'double' to match the type of column 12 named 'rasrank'.
#> Warning: NAs introduced by coercion
#> Warning: Coercing 'character' RHS to 'double' to match the type of column 13 named 'elitistants'.
#> Warning: NAs introduced by coercion
#> Warning: Coercing 'character' RHS to 'double' to match the type of column 13 named 'elitistants'.
#> Warning: NAs introduced by coercion
#> Warning: Removed 544 rows containing non-finite outside the scale range
#> (`stat_parallel_sets()`).
#> Warning: Removed 544 rows containing non-finite outside the scale range
#> (`stat_parallel_sets_axes()`).
#> Warning: Removed 544 rows containing non-finite outside the scale range
#> (`stat_parallel_sets_axes()`).
 # \donttest{
parallel_cat(iraceResults, by_n_param = 6)
#> Warning: Coercing 'character' RHS to 'double' to match the type of column 5 named 'alpha'.
#> Warning: NAs introduced by coercion
#> Warning: Coercing 'character' RHS to 'double' to match the type of column 5 named 'alpha'.
#> Warning: NAs introduced by coercion
#> Warning: Coercing 'character' RHS to 'double' to match the type of column 6 named 'beta'.
#> Warning: NAs introduced by coercion
#> Warning: Coercing 'character' RHS to 'double' to match the type of column 6 named 'beta'.
#> Warning: NAs introduced by coercion
#> Warning: Coercing 'character' RHS to 'double' to match the type of column 7 named 'rho'.
#> Warning: NAs introduced by coercion
#> Warning: Coercing 'character' RHS to 'double' to match the type of column 7 named 'rho'.
#> Warning: NAs introduced by coercion
#> Warning: Coercing 'character' RHS to 'double' to match the type of column 8 named 'ants'.
#> Warning: NAs introduced by coercion
#> Warning: Coercing 'character' RHS to 'double' to match the type of column 8 named 'ants'.
#> Warning: NAs introduced by coercion
#> Warning: Coercing 'character' RHS to 'double' to match the type of column 9 named 'nnls'.
#> Warning: NAs introduced by coercion
#> Warning: Coercing 'character' RHS to 'double' to match the type of column 9 named 'nnls'.
#> Warning: NAs introduced by coercion
#> Warning: Coercing 'character' RHS to 'double' to match the type of column 10 named 'q0'.
#> Warning: NAs introduced by coercion
#> Warning: Coercing 'character' RHS to 'double' to match the type of column 10 named 'q0'.
#> Warning: NAs introduced by coercion
#> Warning: Coercing 'character' RHS to 'double' to match the type of column 12 named 'rasrank'.
#> Warning: NAs introduced by coercion
#> Warning: Coercing 'character' RHS to 'double' to match the type of column 12 named 'rasrank'.
#> Warning: NAs introduced by coercion
#> Warning: Coercing 'character' RHS to 'double' to match the type of column 13 named 'elitistants'.
#> Warning: NAs introduced by coercion
#> Warning: Coercing 'character' RHS to 'double' to match the type of column 13 named 'elitistants'.
#> Warning: NAs introduced by coercion
#> [[1]]
#> Warning: Removed 216 rows containing non-finite outside the scale range
#> (`stat_parallel_sets()`).
#> Warning: Removed 216 rows containing non-finite outside the scale range
#> (`stat_parallel_sets_axes()`).
#> Warning: Removed 216 rows containing non-finite outside the scale range
#> (`stat_parallel_sets_axes()`).
# \donttest{
parallel_cat(iraceResults, by_n_param = 6)
#> Warning: Coercing 'character' RHS to 'double' to match the type of column 5 named 'alpha'.
#> Warning: NAs introduced by coercion
#> Warning: Coercing 'character' RHS to 'double' to match the type of column 5 named 'alpha'.
#> Warning: NAs introduced by coercion
#> Warning: Coercing 'character' RHS to 'double' to match the type of column 6 named 'beta'.
#> Warning: NAs introduced by coercion
#> Warning: Coercing 'character' RHS to 'double' to match the type of column 6 named 'beta'.
#> Warning: NAs introduced by coercion
#> Warning: Coercing 'character' RHS to 'double' to match the type of column 7 named 'rho'.
#> Warning: NAs introduced by coercion
#> Warning: Coercing 'character' RHS to 'double' to match the type of column 7 named 'rho'.
#> Warning: NAs introduced by coercion
#> Warning: Coercing 'character' RHS to 'double' to match the type of column 8 named 'ants'.
#> Warning: NAs introduced by coercion
#> Warning: Coercing 'character' RHS to 'double' to match the type of column 8 named 'ants'.
#> Warning: NAs introduced by coercion
#> Warning: Coercing 'character' RHS to 'double' to match the type of column 9 named 'nnls'.
#> Warning: NAs introduced by coercion
#> Warning: Coercing 'character' RHS to 'double' to match the type of column 9 named 'nnls'.
#> Warning: NAs introduced by coercion
#> Warning: Coercing 'character' RHS to 'double' to match the type of column 10 named 'q0'.
#> Warning: NAs introduced by coercion
#> Warning: Coercing 'character' RHS to 'double' to match the type of column 10 named 'q0'.
#> Warning: NAs introduced by coercion
#> Warning: Coercing 'character' RHS to 'double' to match the type of column 12 named 'rasrank'.
#> Warning: NAs introduced by coercion
#> Warning: Coercing 'character' RHS to 'double' to match the type of column 12 named 'rasrank'.
#> Warning: NAs introduced by coercion
#> Warning: Coercing 'character' RHS to 'double' to match the type of column 13 named 'elitistants'.
#> Warning: NAs introduced by coercion
#> Warning: Coercing 'character' RHS to 'double' to match the type of column 13 named 'elitistants'.
#> Warning: NAs introduced by coercion
#> [[1]]
#> Warning: Removed 216 rows containing non-finite outside the scale range
#> (`stat_parallel_sets()`).
#> Warning: Removed 216 rows containing non-finite outside the scale range
#> (`stat_parallel_sets_axes()`).
#> Warning: Removed 216 rows containing non-finite outside the scale range
#> (`stat_parallel_sets_axes()`).
 #>
#> [[2]]
#> Warning: Removed 60 rows containing non-finite outside the scale range
#> (`stat_parallel_sets()`).
#> Warning: Computation failed in `stat_parallel_sets()`.
#> Caused by error in `sapply(diagonals, nrow) / 4`:
#> ! non-numeric argument to binary operator
#> Warning: Removed 60 rows containing non-finite outside the scale range
#> (`stat_parallel_sets_axes()`).
#> Warning: Removed 60 rows containing non-finite outside the scale range
#> (`stat_parallel_sets_axes()`).
#>
#> [[2]]
#> Warning: Removed 60 rows containing non-finite outside the scale range
#> (`stat_parallel_sets()`).
#> Warning: Computation failed in `stat_parallel_sets()`.
#> Caused by error in `sapply(diagonals, nrow) / 4`:
#> ! non-numeric argument to binary operator
#> Warning: Removed 60 rows containing non-finite outside the scale range
#> (`stat_parallel_sets_axes()`).
#> Warning: Removed 60 rows containing non-finite outside the scale range
#> (`stat_parallel_sets_axes()`).
 #>
parallel_cat(iraceResults, id_configurations = c(20, 50, 100))
#> Warning: Coercing 'character' RHS to 'double' to match the type of column 5 named 'alpha'.
#> Warning: NAs introduced by coercion
#> Warning: Coercing 'character' RHS to 'double' to match the type of column 5 named 'alpha'.
#> Warning: NAs introduced by coercion
#> Warning: Coercing 'character' RHS to 'double' to match the type of column 6 named 'beta'.
#> Warning: NAs introduced by coercion
#> Warning: Coercing 'character' RHS to 'double' to match the type of column 6 named 'beta'.
#> Warning: NAs introduced by coercion
#> Warning: Coercing 'character' RHS to 'double' to match the type of column 7 named 'rho'.
#> Warning: NAs introduced by coercion
#> Warning: Coercing 'character' RHS to 'double' to match the type of column 7 named 'rho'.
#> Warning: NAs introduced by coercion
#> Warning: Coercing 'character' RHS to 'double' to match the type of column 8 named 'ants'.
#> Warning: NAs introduced by coercion
#> Warning: Coercing 'character' RHS to 'double' to match the type of column 8 named 'ants'.
#> Warning: NAs introduced by coercion
#> Warning: Coercing 'character' RHS to 'double' to match the type of column 9 named 'nnls'.
#> Warning: NAs introduced by coercion
#> Warning: Coercing 'character' RHS to 'double' to match the type of column 10 named 'q0'.
#> Warning: NAs introduced by coercion
#> Warning: Coercing 'character' RHS to 'double' to match the type of column 12 named 'rasrank'.
#> Warning: NAs introduced by coercion
#> Warning: Coercing 'character' RHS to 'double' to match the type of column 13 named 'elitistants'.
#> Warning: NAs introduced by coercion
#> Warning: Removed 19 rows containing non-finite outside the scale range
#> (`stat_parallel_sets()`).
#> Warning: Removed 19 rows containing non-finite outside the scale range
#> (`stat_parallel_sets_axes()`).
#> Warning: Computation failed in `stat_parallel_sets_axes()`.
#> Caused by error in `compute_panel()`:
#> ! Axis aesthetics must be constant in each split
#> Warning: Removed 19 rows containing non-finite outside the scale range
#> (`stat_parallel_sets_axes()`).
#> Warning: Computation failed in `stat_parallel_sets_axes()`.
#> Caused by error in `compute_panel()`:
#> ! Axis aesthetics must be constant in each split
#>
parallel_cat(iraceResults, id_configurations = c(20, 50, 100))
#> Warning: Coercing 'character' RHS to 'double' to match the type of column 5 named 'alpha'.
#> Warning: NAs introduced by coercion
#> Warning: Coercing 'character' RHS to 'double' to match the type of column 5 named 'alpha'.
#> Warning: NAs introduced by coercion
#> Warning: Coercing 'character' RHS to 'double' to match the type of column 6 named 'beta'.
#> Warning: NAs introduced by coercion
#> Warning: Coercing 'character' RHS to 'double' to match the type of column 6 named 'beta'.
#> Warning: NAs introduced by coercion
#> Warning: Coercing 'character' RHS to 'double' to match the type of column 7 named 'rho'.
#> Warning: NAs introduced by coercion
#> Warning: Coercing 'character' RHS to 'double' to match the type of column 7 named 'rho'.
#> Warning: NAs introduced by coercion
#> Warning: Coercing 'character' RHS to 'double' to match the type of column 8 named 'ants'.
#> Warning: NAs introduced by coercion
#> Warning: Coercing 'character' RHS to 'double' to match the type of column 8 named 'ants'.
#> Warning: NAs introduced by coercion
#> Warning: Coercing 'character' RHS to 'double' to match the type of column 9 named 'nnls'.
#> Warning: NAs introduced by coercion
#> Warning: Coercing 'character' RHS to 'double' to match the type of column 10 named 'q0'.
#> Warning: NAs introduced by coercion
#> Warning: Coercing 'character' RHS to 'double' to match the type of column 12 named 'rasrank'.
#> Warning: NAs introduced by coercion
#> Warning: Coercing 'character' RHS to 'double' to match the type of column 13 named 'elitistants'.
#> Warning: NAs introduced by coercion
#> Warning: Removed 19 rows containing non-finite outside the scale range
#> (`stat_parallel_sets()`).
#> Warning: Removed 19 rows containing non-finite outside the scale range
#> (`stat_parallel_sets_axes()`).
#> Warning: Computation failed in `stat_parallel_sets_axes()`.
#> Caused by error in `compute_panel()`:
#> ! Axis aesthetics must be constant in each split
#> Warning: Removed 19 rows containing non-finite outside the scale range
#> (`stat_parallel_sets_axes()`).
#> Warning: Computation failed in `stat_parallel_sets_axes()`.
#> Caused by error in `compute_panel()`:
#> ! Axis aesthetics must be constant in each split
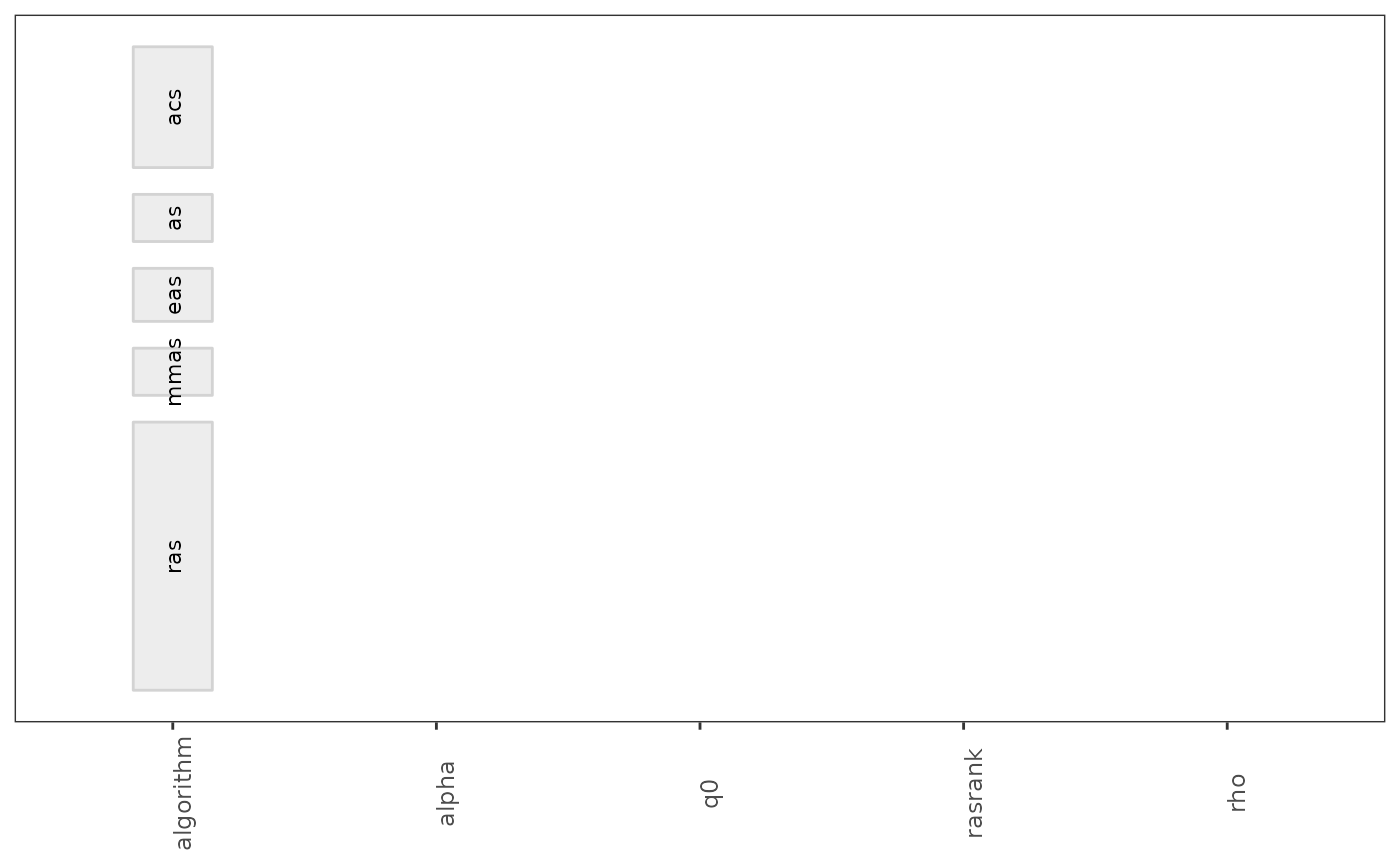
 parallel_cat(iraceResults, param_names = c("algorithm", "alpha", "rho", "q0", "rasrank"))
#> Warning: Coercing 'character' RHS to 'double' to match the type of column 5 named 'alpha'.
#> Warning: NAs introduced by coercion
#> Warning: Coercing 'character' RHS to 'double' to match the type of column 5 named 'alpha'.
#> Warning: NAs introduced by coercion
#> Warning: Coercing 'character' RHS to 'double' to match the type of column 6 named 'beta'.
#> Warning: NAs introduced by coercion
#> Warning: Coercing 'character' RHS to 'double' to match the type of column 6 named 'beta'.
#> Warning: NAs introduced by coercion
#> Warning: Coercing 'character' RHS to 'double' to match the type of column 7 named 'rho'.
#> Warning: NAs introduced by coercion
#> Warning: Coercing 'character' RHS to 'double' to match the type of column 7 named 'rho'.
#> Warning: NAs introduced by coercion
#> Warning: Coercing 'character' RHS to 'double' to match the type of column 8 named 'ants'.
#> Warning: NAs introduced by coercion
#> Warning: Coercing 'character' RHS to 'double' to match the type of column 8 named 'ants'.
#> Warning: NAs introduced by coercion
#> Warning: Coercing 'character' RHS to 'double' to match the type of column 9 named 'nnls'.
#> Warning: NAs introduced by coercion
#> Warning: Coercing 'character' RHS to 'double' to match the type of column 9 named 'nnls'.
#> Warning: NAs introduced by coercion
#> Warning: Coercing 'character' RHS to 'double' to match the type of column 10 named 'q0'.
#> Warning: NAs introduced by coercion
#> Warning: Coercing 'character' RHS to 'double' to match the type of column 10 named 'q0'.
#> Warning: NAs introduced by coercion
#> Warning: Coercing 'character' RHS to 'double' to match the type of column 12 named 'rasrank'.
#> Warning: NAs introduced by coercion
#> Warning: Coercing 'character' RHS to 'double' to match the type of column 12 named 'rasrank'.
#> Warning: NAs introduced by coercion
#> Warning: Coercing 'character' RHS to 'double' to match the type of column 13 named 'elitistants'.
#> Warning: NAs introduced by coercion
#> Warning: Coercing 'character' RHS to 'double' to match the type of column 13 named 'elitistants'.
#> Warning: NAs introduced by coercion
#> Warning: Removed 96 rows containing non-finite outside the scale range
#> (`stat_parallel_sets()`).
#> Warning: Computation failed in `stat_parallel_sets()`.
#> Caused by error in `sapply(diagonals, nrow) / 4`:
#> ! non-numeric argument to binary operator
#> Warning: Removed 96 rows containing non-finite outside the scale range
#> (`stat_parallel_sets_axes()`).
#> Warning: Removed 96 rows containing non-finite outside the scale range
#> (`stat_parallel_sets_axes()`).
parallel_cat(iraceResults, param_names = c("algorithm", "alpha", "rho", "q0", "rasrank"))
#> Warning: Coercing 'character' RHS to 'double' to match the type of column 5 named 'alpha'.
#> Warning: NAs introduced by coercion
#> Warning: Coercing 'character' RHS to 'double' to match the type of column 5 named 'alpha'.
#> Warning: NAs introduced by coercion
#> Warning: Coercing 'character' RHS to 'double' to match the type of column 6 named 'beta'.
#> Warning: NAs introduced by coercion
#> Warning: Coercing 'character' RHS to 'double' to match the type of column 6 named 'beta'.
#> Warning: NAs introduced by coercion
#> Warning: Coercing 'character' RHS to 'double' to match the type of column 7 named 'rho'.
#> Warning: NAs introduced by coercion
#> Warning: Coercing 'character' RHS to 'double' to match the type of column 7 named 'rho'.
#> Warning: NAs introduced by coercion
#> Warning: Coercing 'character' RHS to 'double' to match the type of column 8 named 'ants'.
#> Warning: NAs introduced by coercion
#> Warning: Coercing 'character' RHS to 'double' to match the type of column 8 named 'ants'.
#> Warning: NAs introduced by coercion
#> Warning: Coercing 'character' RHS to 'double' to match the type of column 9 named 'nnls'.
#> Warning: NAs introduced by coercion
#> Warning: Coercing 'character' RHS to 'double' to match the type of column 9 named 'nnls'.
#> Warning: NAs introduced by coercion
#> Warning: Coercing 'character' RHS to 'double' to match the type of column 10 named 'q0'.
#> Warning: NAs introduced by coercion
#> Warning: Coercing 'character' RHS to 'double' to match the type of column 10 named 'q0'.
#> Warning: NAs introduced by coercion
#> Warning: Coercing 'character' RHS to 'double' to match the type of column 12 named 'rasrank'.
#> Warning: NAs introduced by coercion
#> Warning: Coercing 'character' RHS to 'double' to match the type of column 12 named 'rasrank'.
#> Warning: NAs introduced by coercion
#> Warning: Coercing 'character' RHS to 'double' to match the type of column 13 named 'elitistants'.
#> Warning: NAs introduced by coercion
#> Warning: Coercing 'character' RHS to 'double' to match the type of column 13 named 'elitistants'.
#> Warning: NAs introduced by coercion
#> Warning: Removed 96 rows containing non-finite outside the scale range
#> (`stat_parallel_sets()`).
#> Warning: Computation failed in `stat_parallel_sets()`.
#> Caused by error in `sapply(diagonals, nrow) / 4`:
#> ! non-numeric argument to binary operator
#> Warning: Removed 96 rows containing non-finite outside the scale range
#> (`stat_parallel_sets_axes()`).
#> Warning: Removed 96 rows containing non-finite outside the scale range
#> (`stat_parallel_sets_axes()`).
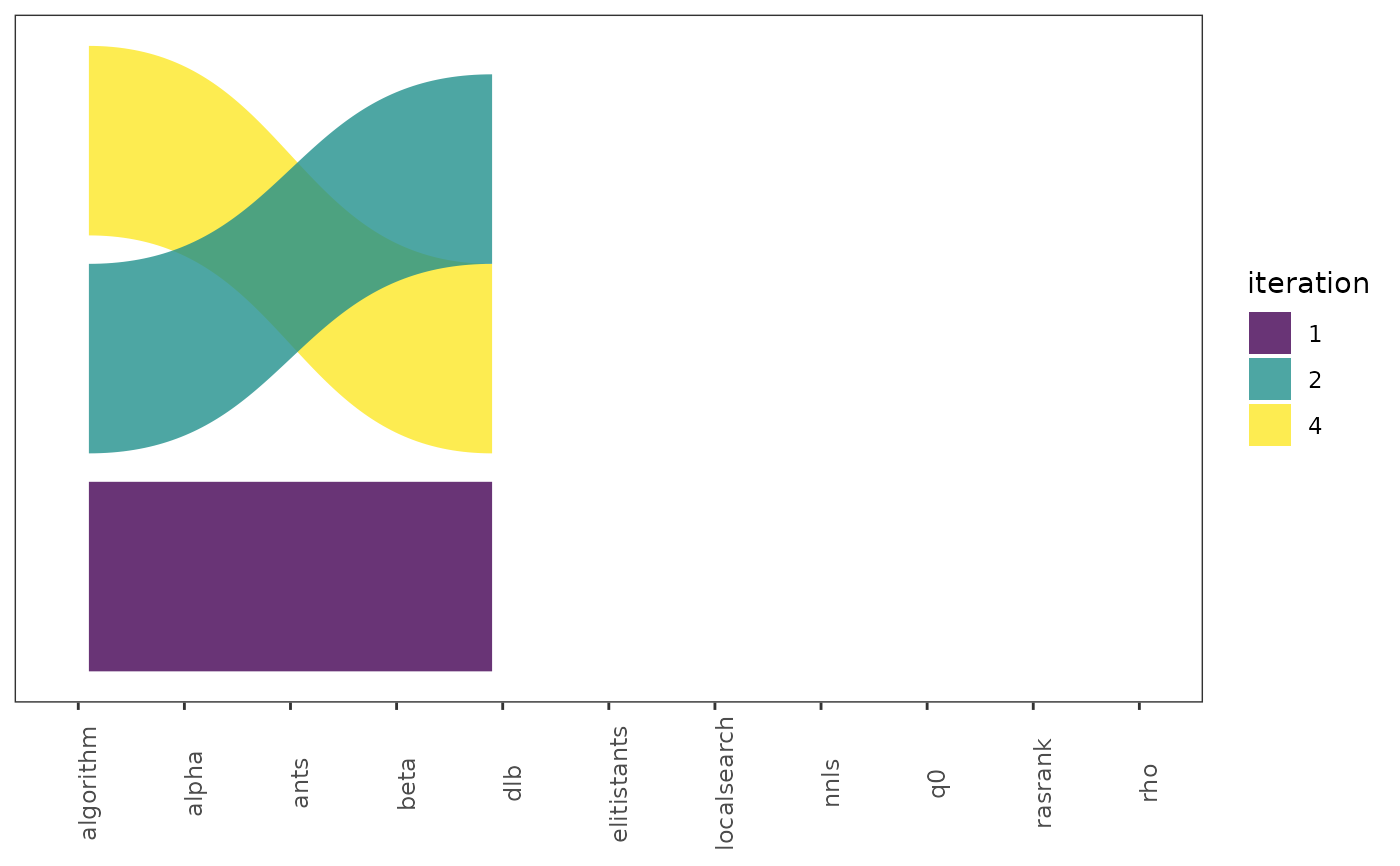
 parallel_cat(iraceResults, iterations = c(1, 4, 6), n_bins=4)
#> Warning: Coercing 'character' RHS to 'double' to match the type of column 5 named 'alpha'.
#> Warning: NAs introduced by coercion
#> Warning: Coercing 'character' RHS to 'double' to match the type of column 5 named 'alpha'.
#> Warning: NAs introduced by coercion
#> Warning: Coercing 'character' RHS to 'double' to match the type of column 6 named 'beta'.
#> Warning: NAs introduced by coercion
#> Warning: Coercing 'character' RHS to 'double' to match the type of column 6 named 'beta'.
#> Warning: NAs introduced by coercion
#> Warning: Coercing 'character' RHS to 'double' to match the type of column 7 named 'rho'.
#> Warning: NAs introduced by coercion
#> Warning: Coercing 'character' RHS to 'double' to match the type of column 7 named 'rho'.
#> Warning: NAs introduced by coercion
#> Warning: Coercing 'character' RHS to 'double' to match the type of column 8 named 'ants'.
#> Warning: NAs introduced by coercion
#> Warning: Coercing 'character' RHS to 'double' to match the type of column 8 named 'ants'.
#> Warning: NAs introduced by coercion
#> Warning: Coercing 'character' RHS to 'double' to match the type of column 9 named 'nnls'.
#> Warning: NAs introduced by coercion
#> Warning: Coercing 'character' RHS to 'double' to match the type of column 9 named 'nnls'.
#> Warning: NAs introduced by coercion
#> Warning: Coercing 'character' RHS to 'double' to match the type of column 10 named 'q0'.
#> Warning: NAs introduced by coercion
#> Warning: Coercing 'character' RHS to 'double' to match the type of column 10 named 'q0'.
#> Warning: NAs introduced by coercion
#> Warning: Coercing 'character' RHS to 'double' to match the type of column 12 named 'rasrank'.
#> Warning: NAs introduced by coercion
#> Warning: Coercing 'character' RHS to 'double' to match the type of column 12 named 'rasrank'.
#> Warning: NAs introduced by coercion
#> Warning: Coercing 'character' RHS to 'double' to match the type of column 13 named 'elitistants'.
#> Warning: NAs introduced by coercion
#> Warning: Coercing 'character' RHS to 'double' to match the type of column 13 named 'elitistants'.
#> Warning: NAs introduced by coercion
#> Warning: Removed 280 rows containing non-finite outside the scale range
#> (`stat_parallel_sets()`).
#> Warning: Removed 280 rows containing non-finite outside the scale range
#> (`stat_parallel_sets_axes()`).
#> Warning: Removed 280 rows containing non-finite outside the scale range
#> (`stat_parallel_sets_axes()`).
parallel_cat(iraceResults, iterations = c(1, 4, 6), n_bins=4)
#> Warning: Coercing 'character' RHS to 'double' to match the type of column 5 named 'alpha'.
#> Warning: NAs introduced by coercion
#> Warning: Coercing 'character' RHS to 'double' to match the type of column 5 named 'alpha'.
#> Warning: NAs introduced by coercion
#> Warning: Coercing 'character' RHS to 'double' to match the type of column 6 named 'beta'.
#> Warning: NAs introduced by coercion
#> Warning: Coercing 'character' RHS to 'double' to match the type of column 6 named 'beta'.
#> Warning: NAs introduced by coercion
#> Warning: Coercing 'character' RHS to 'double' to match the type of column 7 named 'rho'.
#> Warning: NAs introduced by coercion
#> Warning: Coercing 'character' RHS to 'double' to match the type of column 7 named 'rho'.
#> Warning: NAs introduced by coercion
#> Warning: Coercing 'character' RHS to 'double' to match the type of column 8 named 'ants'.
#> Warning: NAs introduced by coercion
#> Warning: Coercing 'character' RHS to 'double' to match the type of column 8 named 'ants'.
#> Warning: NAs introduced by coercion
#> Warning: Coercing 'character' RHS to 'double' to match the type of column 9 named 'nnls'.
#> Warning: NAs introduced by coercion
#> Warning: Coercing 'character' RHS to 'double' to match the type of column 9 named 'nnls'.
#> Warning: NAs introduced by coercion
#> Warning: Coercing 'character' RHS to 'double' to match the type of column 10 named 'q0'.
#> Warning: NAs introduced by coercion
#> Warning: Coercing 'character' RHS to 'double' to match the type of column 10 named 'q0'.
#> Warning: NAs introduced by coercion
#> Warning: Coercing 'character' RHS to 'double' to match the type of column 12 named 'rasrank'.
#> Warning: NAs introduced by coercion
#> Warning: Coercing 'character' RHS to 'double' to match the type of column 12 named 'rasrank'.
#> Warning: NAs introduced by coercion
#> Warning: Coercing 'character' RHS to 'double' to match the type of column 13 named 'elitistants'.
#> Warning: NAs introduced by coercion
#> Warning: Coercing 'character' RHS to 'double' to match the type of column 13 named 'elitistants'.
#> Warning: NAs introduced by coercion
#> Warning: Removed 280 rows containing non-finite outside the scale range
#> (`stat_parallel_sets()`).
#> Warning: Removed 280 rows containing non-finite outside the scale range
#> (`stat_parallel_sets_axes()`).
#> Warning: Removed 280 rows containing non-finite outside the scale range
#> (`stat_parallel_sets_axes()`).
 # }
# }